


Why Is Silver More Volatile Than Gold: How to Measure It
BY TIOmarkets
|November 5, 2026Silver's volatility gap with gold is the extent to which XAG/USD's percentage price swings exceed those of XAU/USD, measured as a multiple of gold's volatility over a chosen window. To the question “why is silver more volatile than gold”, the answer is structural: a smaller market, industry-led demand, by-product supply and no central bank buyer. The gap is not fixed, since it changes with the window measured and with the market regime.
For traders of XAU/USD and XAG/USD, the article compares the two metals' market structure, sets four volatility measures side by side, and shows how to calculate the gap for any window and size positions to reflect it.
Why Is Silver More Volatile Than Gold? Defining Volatility First
Volatility is the dispersion of returns around their average, usually measured as the standard deviation of daily percentage or log returns. It records the size of moves, not their direction. By a widely used convention, the daily figure is annualised by multiplying it by the square root of 252. The annualised number describes the window behind it and nothing beyond, so two windows can give quite different answers for the same metal.
Any comparison between the two metals must therefore use percentages. On 4 November 2026 spot gold stood at $4,061.30 an ounce and spot silver at $52.29, so a move of the same dollar size was a far larger share of silver's price than of gold's. Comparing dollar moves alone would make gold look the more volatile metal.
Market Size and Liquidity: Why a Smaller Market Moves Further
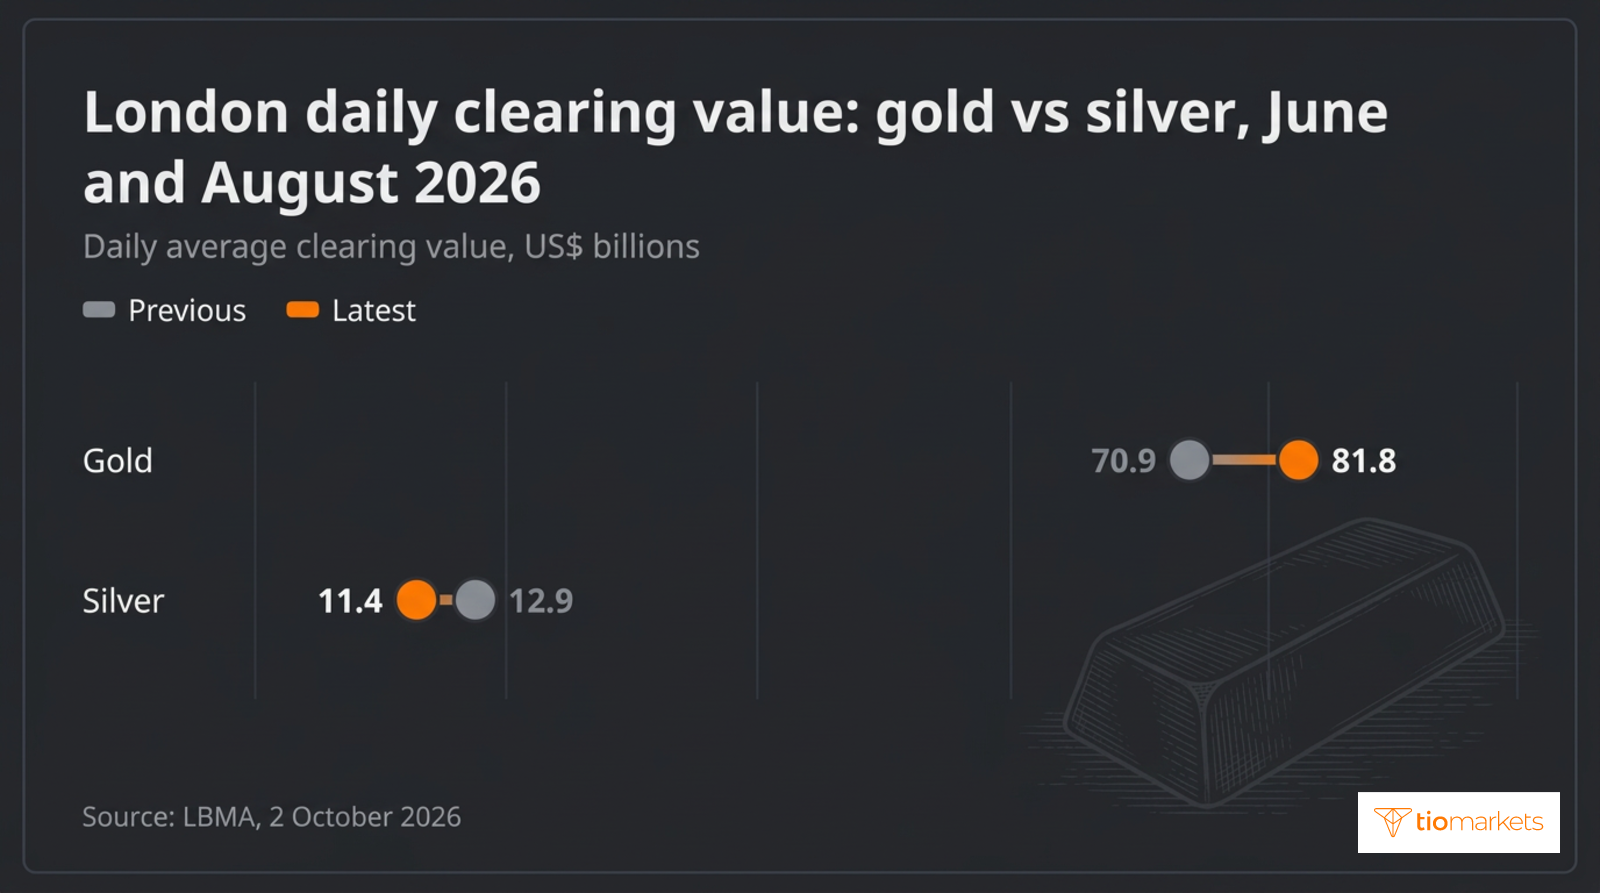
Liquidity, the ease of filling a trade without moving the price, depends on the value that changes hands rather than the number of ounces. In August 2026 London cleared a daily average of 175.1 million ounces of silver against 18.6 million ounces of gold. Measured in money, the order reverses: that silver was worth $11.4bn a day and the gold $81.8bn, while in June 2026 the daily values were $12.9bn for silver and $70.9bn for gold.
A market of that size absorbs the same order flow with a larger price adjustment. Its bid-ask spread also tends to be wider relative to price, a pattern that reflects how liquidity providers affect spreads and execution in currency markets too.
Futures add a second amplifier. On COMEX, the main US metals futures exchange, a gold contract covers 100 troy ounces and a silver contract 5,000, both traded on margin. When a falling market triggers a margin call that goes unmet, a stop out can close positions automatically into thin market depth. Leverage enlarges losses exactly as it enlarges gains, losses on a margined metals position can accumulate within a single session, and a trader can lose all the money deposited.
How Industrial Demand Affects Silver Prices Through the Manufacturing Cycle
Silver is both a precious metal and an industrial input. Total silver demand fell 2% to 1.13 billion ounces in 2025. Industrial use took 657.4 million ounces of that total, despite a 3% fall that ended four years of strong growth, and electrical and electronics demand fell 2%. A 14% jump in coin and bar buying almost offset declines elsewhere.
Industrial demand affects the price in two ways. Silver typically forms a small part of the cost of solar panels and electronics, so manufacturers tend to keep buying as the price rises, which makes their demand largely insensitive to price. The volume they need, however, follows the manufacturing cycle. That cyclical link helps explain why silver falls harder than gold when markets fear a slowdown.
Gold's demand mix is close to the reverse. Total gold demand, including over-the-counter trading, reached a record 4,974 tonnes in 2024, and central banks bought 1,045 tonnes of it. Net official buying exceeded 1,000 tonnes in each of the three years to 2024, against a 473-tonne annual average for 2010–2021. Additions to central bank reserves give gold a persistent buyer. Silver has no equivalent holder.
How By-Product Mining Affects Silver Supply
Under by-product mining, silver is recovered from ores worked mainly for other metals such as copper and zinc. Over 2019–23, by-product silver made up 21% of mine production in North America and 63% in South America, and the two regions each produced 29% of world silver mine output. Global output rose 3% to 846.6 million ounces in 2025, helped by higher by-product output from Peru's copper operations. Because so much supply follows the economics of other metals, it responds slowly to the silver price, and the price itself does more of the adjusting.
Silver vs Gold Volatility: Four Ways to Measure the Gap
Structure explains why a gap exists; measurement shows how large it is. The standard deviation of returns, calculated for both metals over the same window, gives the broadest picture, and silver's figure divided by gold's is its volatility multiple for that window.
J. Welles Wilder introduced the average true range (ATR) in his 1978 book New Concepts in Technical Trading Systems. It averages the true range, the largest of the high-low range and the distances from the previous close to the high and to the low, over a default 14 periods. Because ATR is quoted in dollars, a silver vs gold ATR comparison works only once each metal's ATR is divided by its price.
Beta measures how far silver has moved, on average, per percentage-point move in gold: the covariance of their returns divided by the variance of gold's. Estimating it requires many paired returns over a window. When correlation weakens, a stable-looking beta can conceal large independent swings.
Each measure answers a different question, and none captures the gap alone:
| Measure | What the chart or market shows | The approach traders use for it | Main risk |
| Standard deviation | Daily returns varying in size from session to session | Annualised standard deviation of daily log returns, silver's divided by gold's | Assumes stable variance; results shift between windows |
| ATR as a share of price | Wide intraday ranges and overnight gaps | 14-period ATR divided by the latest close for each metal | Slow to react; raw ATR in dollars misleads |
| Beta to gold | Silver moving with gold by a larger amount | Regression of silver's daily returns on gold's over a set window | Loses meaning when correlation weakens |
| Gold-silver ratio | One metal outpacing the other over weeks or months | Tracking the ratio's level and change over time | Shows relative price, not the size of daily swings |
What Is the Gold-Silver Ratio?
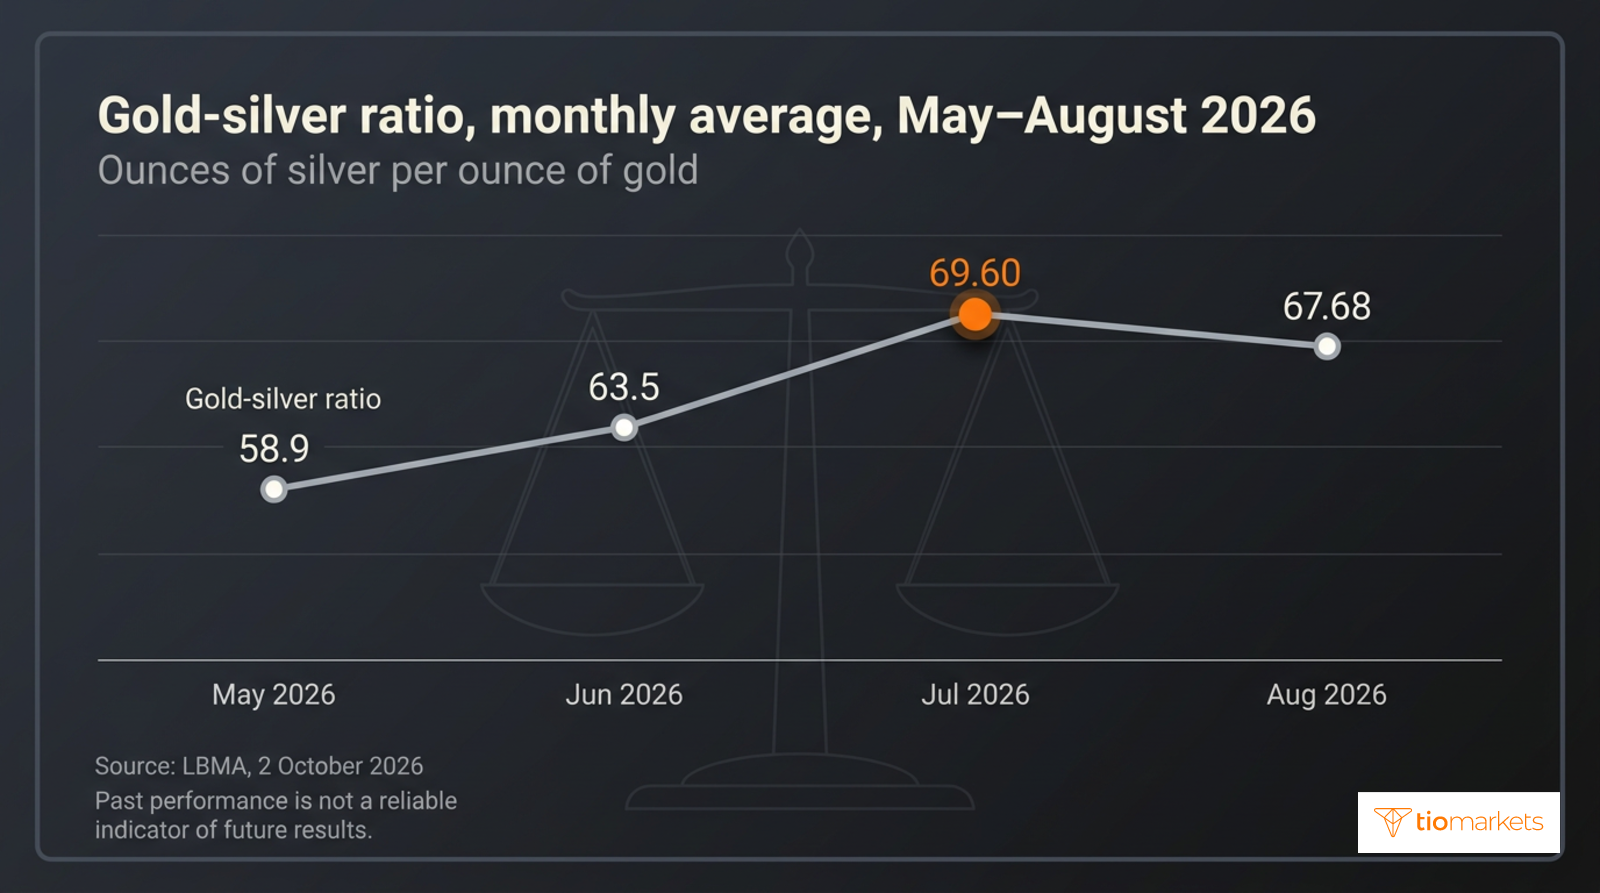
The gold-silver ratio, the ounces of silver needed to buy one ounce of gold, measures relative price rather than volatility. Its London monthly average rose from 58.9 in May 2026 to 63.5 in June and 69.60 in July, before easing to 67.68 in August, so silver underperformed gold in relative price over that spell. These readings are history, and past performance is not a reliable indicator of future results.
How to Measure Silver Volatility Against Gold, Step by Step
Silver's volatility multiple can be calculated from daily closes in a spreadsheet, in six steps:
- Collect daily closes for XAU/USD and XAG/USD over the same trading days, from one data source.
- Convert each close into a log return: the natural logarithm of the close divided by the previous close.
- Calculate each series' standard deviation and multiply it by the square root of 252 for an annual figure.
- Divide silver's figure by gold's to obtain the volatility multiple for that window.
- Cross-check by dividing each metal's 14-period ATR by its latest close.
- Repeat over a shorter and a longer window and note how far the multiple changes.
Each result describes only its own window, and a multiple taken from a calm month can understate silver's swings in a disorderly one.
As a worked example only, on 4 November 2026 spot gold rose 3.4% and spot silver 5.1%. Dividing silver's move by gold's gives a one-day multiple that illustrates the arithmetic but estimates nothing. Cumulative returns measure something else: gold rose 66% and silver 135% over 2025, figures that record direction and total change rather than the size of daily swings. Past performance is not a reliable indicator of future results.
Position Sizing for Silver vs Gold: Matching Risk, Not Lots
Equal notional exposure, the full market value of a position, does not carry equal risk when silver's measured volatility is higher. Volatility-based sizing scales each position so that a typical move costs a similar amount in either metal. The method has five steps:
- Express each metal's recent volatility as a percentage, from daily standard deviation or ATR as a share of price.
- Set one amount of money at risk per position, the same for both metals.
- Divide that amount by each volatility percentage to find the matching notional exposure.
- Convert notional into units with the contract specification; how to calculate lot size, pip value and margin applies the same method to a currency pair.
- Check the margin each position needs and how far the price can move before a margin call.
As a hypothetical illustration using the 4 November 2026 moves, a gold position changed in value by 3.4% and an equal silver notional by 5.1%. Matching gold's swing on that day would have required silver notional equal to gold's multiplied by 3.4 and divided by 5.1. The calculation sets no size for any actual trade, and a single day's moves are no reliable guide to future ones.
Retail traders often hold both metals through gold and silver CFDs, contracts that track price without ownership and are usually traded with leverage. Leverage magnifies losses on a silver position as much as gains; because silver moves further, those losses can build quickly, and a trader can lose all the money deposited. Matching volatility across the two positions caps the loss on neither.
Common Mistakes When Comparing Gold and Silver Volatility
Most comparison errors treat one measurement as a permanent fact:
- Comparing dollar moves. Only percentage returns or ATR as a share of price compare a high-priced and a low-priced metal fairly.
- Treating one window as permanent. A multiple from one period can differ sharply in the next.
- Assuming silver always amplifies gold. A rising gold-silver ratio shows only that silver lagged gold in relative price; whether silver fell further or rose less can be judged only from each metal's own returns.
- Using the same notional in both metals. The silver position then carries more risk whenever its volatility is higher.
- Relying on beta without checking correlation. A beta estimated over a weakly correlated period says little.
Conclusion
Silver's extra volatility is a product of market structure, not a law. A thinner market, industrial demand tied to the manufacturing cycle, supply linked to copper mining and the absence of an official buyer leave XAG/USD prone to larger percentage moves than XAU/USD. The size of that gap is a number to calculate for each window, and it determines how much risk the same position size carries in each metal.
Every measure has limits. Standard deviation and ATR describe only the window behind them, beta depends on correlation, and the ratio tracks relative price rather than daily swings. Sizing for the measured gap corrects one mismatch but leaves the underlying risk in place: leverage enlarges losses as well as gains, a metals position can lose money rapidly, and a trader can lose everything deposited.
Trade XAU/USD and XAG/USD with TIOmarkets
Take your position on global markets via CFDs. Enjoy tight spreads, fast execution, and fast, flexible funding options.
Trading is risky
FAQ
Risk disclaimer: CFDs are complex instruments and come with a high risk of losing money rapidly due to leverage. You should consider whether you understand how CFDs work and whether you can afford to take the high risk of losing your money. Never deposit more than you are prepared to lose. Professional client’s losses can exceed their deposit. Please see our risk warning policy and seek independent professional advice if you do not fully understand. This information is not directed or intended for distribution to or use by residents of certain countries/jurisdictions including, but not limited to, USA & Countries included in the OFAC sanction list. The Company holds the right to alter the aforementioned list of countries at its own discretion.
TIOmarkets offers an exclusively execution-only service. The views expressed are for information purposes only. None of the content provided constitutes any form of investment advice. The comments are made available purely for educational and marketing purposes and do NOT constitute advice or investment recommendation (and should not be considered as such) and do not in any way constitute an invitation to acquire any financial instrument or product. TIOmarkets and its affiliates and consultants are not liable for any damages that may be caused by individual comments or statements by TIOmarkets analysis and assumes no liability with respect to the completeness and correctness of the content presented. The investor is solely responsible for the risk of his/her investment decisions. The analyses and comments presented do not include any consideration of your personal investment objectives, financial circumstances, or needs. The content has not been prepared in accordance with any legal requirements for financial analysis and must, therefore, be viewed by the reader as marketing information. TIOmarkets prohibits duplication or publication without explicit approval.
Join us on social media


Authors BIO

Behind every blog post lies the combined experience of the people working at TIOmarkets. We are a team of dedicated industry professionals and financial markets enthusiasts committed to providing you with trading education and financial markets commentary. Our goal is to help empower you with the knowledge you need to trade in the markets effectively.





