


Comparing Fundamental Analysis vs Technical Analysis in Trading
BY Maria K.
|September 4, 2026Fundamental analysis vs technical analysis represents the two primary methods traders use to evaluate markets and make trading decisions.
- Fundamental analysis examines economic data, financial reports, and overall market conditions to determine an asset's intrinsic value.
- Technical analysis studies price charts, patterns, and indicators to help online traders time their trade entries and exits.
For online traders, understanding the difference between fundamental and technical analysis is essential: technical analysis typically dominates short-term trading decisions, while fundamental analysis shapes longer-term directional bias and asset selection.
Key takeaway: What is the difference between fundamental analysis vs technical analysis?
- Fundamental analysts examine things like company earnings, economic reports, interest rate decisions, and supply/demand dynamics to decide if an asset should rise or fall in value over time.
- Technical analysts study price charts, support/resistance levels, trend indicators, and momentum oscillators to identify optimal entry points, stop-loss levels, and profit targets.
This guide explores both methods from a trader's perspective, examining how each approach works in practice and helping you determine which analysis is better for trading based on your style and goals. Most professional traders incorporate elements of both fundamental and technical analysis, and by the end of this article, you'll understand how to apply each method effectively.
What Is Fundamental Analysis? A Trader's Perspective
Fundamental analysis is a method of evaluating tradeable assets by examining economic and financial factors that influence value. Things like earnings reports, interest rate decisions, supply/demand dynamics, and macroeconomic data can then determine whether an asset is overvalued or undervalued for trading decisions.
TIOmarkets provides daily market analysis covering forex, stocks, indices, and commodities, helping traders stay updated on key fundamental drivers without spending hours on research.
Core Principles of Fundamental Analysis for Traders
The foundation of fundamental analysis rests on the concept of intrinsic value: the idea that assets have a "true" value that market price eventually reflects. For traders, this creates opportunities when market prices diverge significantly from calculated intrinsic value.
Catalyst identification represents another core principle. Major news events and data releases - such as earnings announcements, Federal Reserve meetings, or employment reports - create trading opportunities by shifting market perceptions of value. Those who understand fundamental and technical analysis for traders recognize these catalysts as potential profit opportunities.
Fundamentals also help establish directional bias. Before entering any trade, traders can understand whether underlying economic conditions support bullish or bearish positioning on a particular asset.
Key Fundamental Data Traders Monitor
Different markets require attention to different fundamental factors.
- Stocks: Earnings reports, revenue growth, forward guidance, SEC filings, and sector trends form the foundation of stock fundamental analysis. Quarterly earnings releases often create significant price movements that traders anticipate and trade around.
- Forex: Interest rate decisions, GDP releases, employment data, central bank statements, and inflation reports drive currency valuations. The forex technical vs fundamental analysis trading debate often centers on how traders weigh these macroeconomic factors against chart patterns.
- Crypto: On-chain metrics, adoption rates, protocol developments, and regulatory news influence cryptocurrency valuations. Crypto fundamental vs technical analysis discussions acknowledge that crypto fundamentals remain less established than traditional markets.
- Commodities: Supply/demand reports, inventory data, weather patterns, and geopolitical events affect commodity prices directly through their impact on available supply and consumption demand.
How Fundamental Analysis Works in a Forex Trade Setup
Consider trading around earnings announcements. For example, a trader might analyze earnings per share (EPS) expectations, compare them to historical performance, assess current price positioning relative to the expected announcement, and establish a directional bias based on whether the company appears likely to beat or miss expectations.
Another example is traders analyzing economic projections, previous Fed communications, and market expectations around Fed interest rate decisions, to position themselves for potential currency movements following the announcement.
What Is Technical Analysis? Trading Perspective
Technical analysis is a method of analyzing price charts, patterns, and indicators to forecast future price movements and time trade entries and exits. This is based on the premise that price action reflects all known information and that patterns tend to repeat.
Core Principles of Technical Analysis for Traders
The principle that "price discounts everything" suggests all known information, fundamental, psychological, and otherwise, is already reflected in an asset's price. Technical analysts therefore focus on price itself rather than underlying causes.
Technical analysis assumes price moves in trends. Identifying and trading with established trends, rather than against them, is generally believed to improve trading outcomes. This principle drives many technical strategies.
The idea that history tends to repeat underlies pattern recognition in technical analysis. Support and resistance levels, chart patterns, and indicator readings that produced certain outcomes historically may produce similar outcomes in the future.
For traders, technical analysis excels at risk/reward framing. Technical levels define where to enter trades, where to exit if wrong (stop-loss), and where to take profits; creating clear trade management rules.
Common Technical Tools Active Traders Use
- Chart Types: Candlestick charts remain the most popular among active traders, providing visual information about open, high, low, and close prices. Bar charts and Heikin Ashi charts serve as alternatives.
- Trend Indicators: Moving averages (particularly the 20, 50, and 200-period EMAs and SMAs), trendlines, and price channels help traders identify trend direction and potential reversal points.
- Momentum Indicators: RSI (Relative Strength Index), MACD (Moving Average Convergence Divergence), and Stochastic Oscillator measure the speed and strength of price movements.
- Volume Analysis: Volume profile, On-Balance Volume (OBV), and volume spikes provide insight into the conviction behind price moves.
- Price Action: Support and resistance levels, chart patterns (flags, triangles, head and shoulders), and candlestick patterns form the foundation of many trading strategies.
- Advanced Tools: Fibonacci retracements, Bollinger Bands, and Ichimoku Cloud provide additional analytical frameworks for experienced traders.
How Technical Analysis Works in a Trading Setup
Let’s look at this example. For swing trading a breakout, a trader might identify a consolidation pattern, wait for price to break above resistance with increased volume, enter the trade on confirmation, place a stop-loss below the breakout level, and set a profit target based on the pattern's measured move.
Another scenario is when day traders use moving average crossovers combined with RSI divergence to identify entry points, managing trades based on intraday support and resistance levels.
Fundamental Analysis vs Technical Analysis: Key Differences for Traders
The primary difference between fundamental and technical analysis in trading lies in application: fundamental analysis helps determine what to trade and which direction, while technical analysis helps determine when to trade and where to enter/exit.
Data Sources and Focus
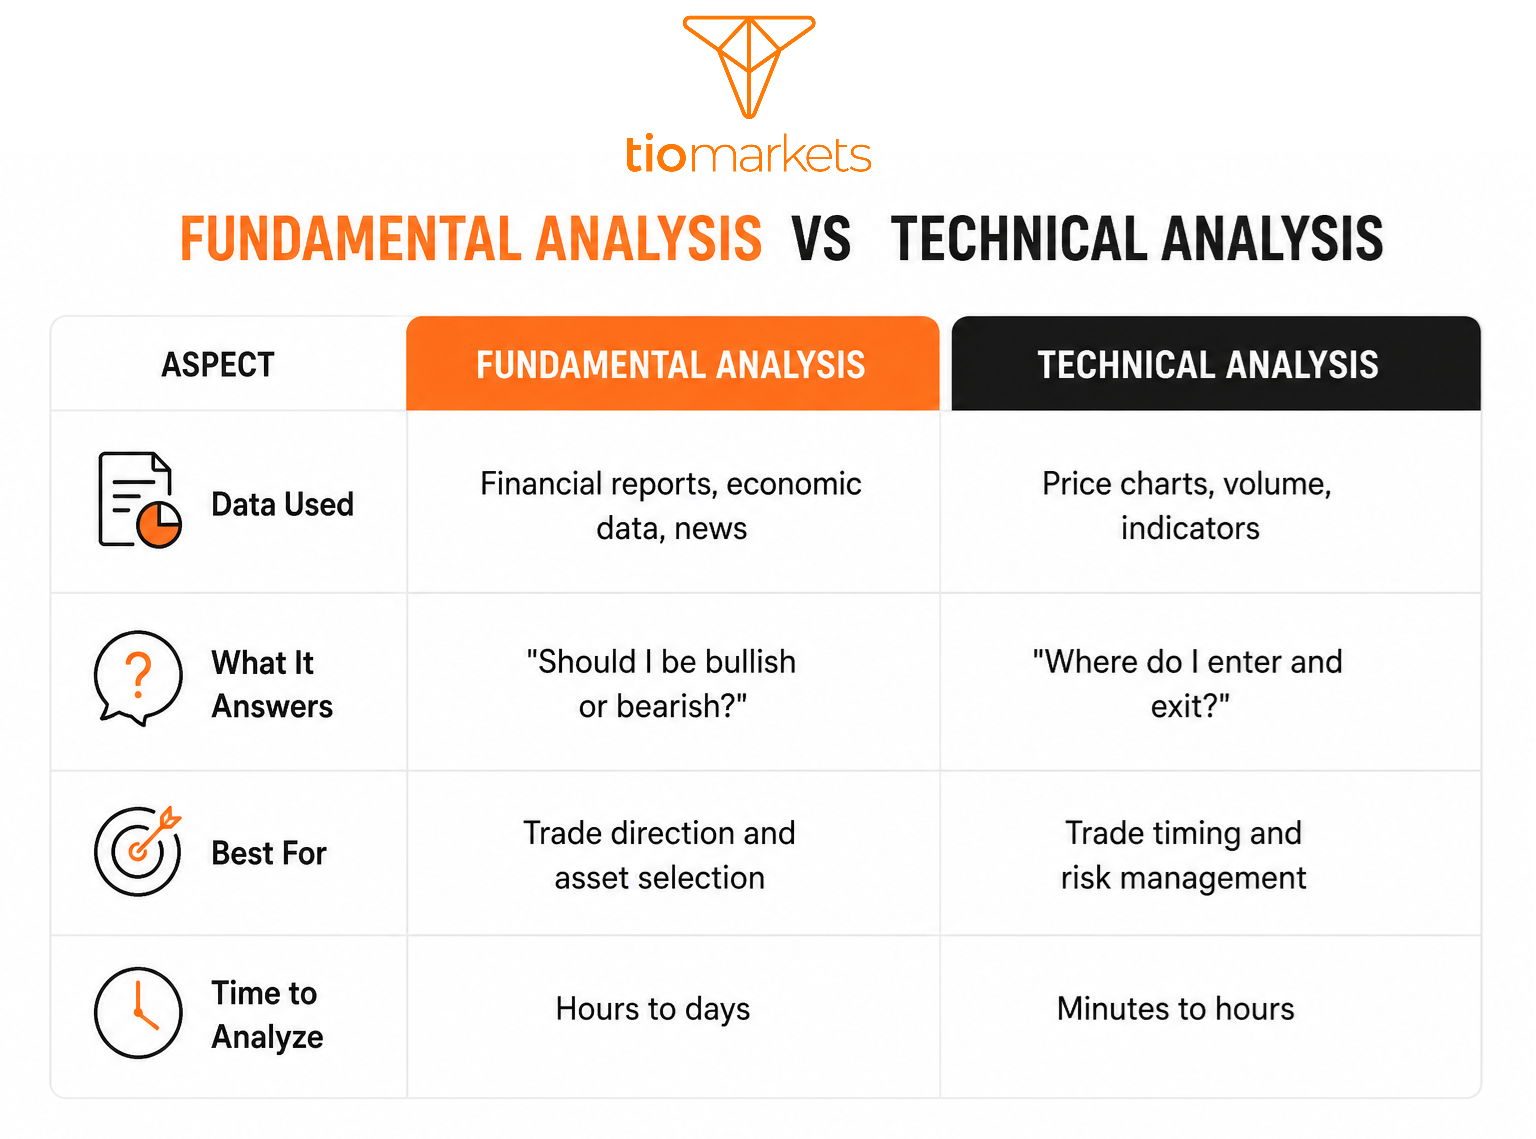
Fundamental and technical analysis differ significantly in their data sources and applications. Fundamental analysis relies on financial reports, economic data, and news events to answer the question "Should I be bullish or bearish?". This makes it best suited for determining trade direction and asset selection, though analysis typically requires hours to days.
Technical analysis, in contrast, uses price charts, volume, and indicators to answer "Where do I enter and exit?". As a result it is ideal for trade timing and risk management, with analysis often completed in minutes to hours. Understanding these distinct applications helps traders recognize that the two methods serve complementary rather than competing purposes in a comprehensive trading approach.
Which Method Is Best for Your Trading Strategy? Time Horizon Differences
Deciding which method is optimum depends heavily on your trading timeframe, as the importance of each approach shifts significantly across different styles. The best analysis method for day trading differs significantly from longer-term approaches.
- Scalping (seconds to minutes): Almost exclusively technical. Trades execute too quickly for fundamental considerations.
- Day trading (minutes to hours): Primarily technical, with awareness of scheduled news events that could invalidate setups.
- Swing trading (days to weeks): Which is better for swing trading, fundamental or technical? Mix of both methods. Most swing traders use fundamentals for direction and technicals for timing.
- Position trading (weeks to months): Fundamental bias with technical entry/exit refinement.
Applying Each Method in Practice: How Each Shapes Trade Decisions
Each analysis method influences trading decisions differently based on its focus. A fundamental approach might lead a trader to conclude "This stock is undervalued based on earnings growth, I want to be long," establishing directional conviction based on financial data.
A technical approach would instead focus on price action: "Price is approaching support with bullish divergence, I'll enter here with a stop below," providing precise entry and risk parameters.
The combined approach merges both perspectives: "Fundamentals are bullish, and I'll buy when technicals confirm at this support level", using fundamentals for directional bias while relying on technicals to optimize entry timing and define risk. This integration represents how many traders operate, allowing each method to contribute where it provides the most value.
Fundamental vs Technical Analysis: Advantages and Limitations for Traders
Both fundamental and technical analysis offer distinct strengths and weaknesses for traders, and understanding these trade-offs helps determine when and how to apply each method effectively within your trading strategy.
Advantages of Fundamental Analysis for Trading
Fundamental analysis provides directional conviction on longer timeframes, helping traders avoid fighting major trends driven by economic forces. It identifies catalyst-driven trade opportunities such as earnings releases and central bank meetings. For traders scanning large asset universes, fundamentals help filter potential trades efficiently.
Limitations of Fundamental Analysis for Trading
Fundamental analysis offers poor timing precision; knowing an asset is undervalued doesn't indicate when price will rise. Markets can remain irrational longer than traders can remain solvent, and by the time fundamental data becomes public, it's often already reflected in price. Fundamentals don't define clear risk parameters for stop-loss placement.
Advantages of Technical Analysis for Trading
Technical analysis provides precise entry and exit points while defining risk/reward ratios before trade entry. It works across all tradeable markets (stocks, forex, crypto, and futures) enabling quick decision-making in fast-moving conditions. Technical strategies can be backtested on historical data.
Limitations of Technical Analysis for Trading
False signals occur regularly, and patterns don't always complete as expected. Different traders often interpret identical charts differently, introducing subjectivity. Sudden fundamental news can invalidate technical setups instantly. When patterns become too popular, crowded trades can fail as too many participants act simultaneously.
Fundamental Analysis vs Technical Analysis: Which Method Matches Your Trading Style
The best analysis method depends on your trading style: day traders and scalpers rely primarily on technical analysis, swing traders benefit from combining both approaches, and position traders often emphasize fundamentals with technical refinement.
Indicative Analysis Methods by Trading Style
| Trading Style | Primary Method | Secondary Method | Reasoning |
| Scalping | Technical (99%) | None | Trades last seconds |
| Day Trading | Technical (90%) | Fundamental awareness (10%) | Need precise timing |
| Swing Trading | Both (50/50) | — | Direction + timing |
| Position Trading | Fundamental (60%) | Technical (40%) | Long-term thesis |
Matching Your Analysis to Your Assets
- High-volatility assets (crypto, stocks): Technical analysis often dominates because fundamentals remain unclear or rapidly changing.
- Forex pairs: Technical analysis vs fundamental analysis forex trading typically involves using both: macro for direction, technicals for execution.
- Commodities: Supply/demand fundamentals combined with technical breakout trading.
Fundamental Analysis vs Technical Analysis: How to Combine in Trading
The most effective trading approach for many traders combines fundamental analysis to determine what to trade and directional bias with technical analysis to determine when to trade and where to enter/exit with defined risk.
Understanding how to combine fundamental and technical analysis in trading starts with this framework.
- WHAT to trade: Use fundamentals to identify assets with catalysts or strong/weak underlying trends.
- WHEN to trade: Use technicals to time entries around key levels or confirmed setups.
- WHERE to enter/exit: Use technicals to define entry price, stop-loss placement, and profit targets.
Practical Combined Trade Examples
Stock Swing Trade: Fundamental analysis reveals a company beat earnings and raised guidance with sector strength, establishing bullish bias. Technical analysis identifies a pullback to the 20 EMA and support level, providing entry with a stop below support.
Forex Trade: Fundamental analysis suggests the Fed will remain hawkish while the ECB signals cuts, bullish USD bias. Technical analysis identifies EUR/USD approaching major support, short entry on breakdown confirmation with stop above resistance.
Crypto Position Trade: Fundamental analysis notes Bitcoin halving approaching with accumulation on-chain, bullish bias. Technical analysis shows price above the 200 MA forming higher lows, entry on daily pullback to support.
Fundamental Analysis vs Technical Analysis: When There’s Conflict
When technical signals suggest buying but fundamentals suggest selling, traders usually consider smaller position sizes or wait for alignment. When fundamentals are bullish but technicals suggest waiting, they avoid chasing and let technicals provide a lower-risk entry point. When signals conflict significantly, staying out often proves prudent; conflicting signals frequently indicate choppy, difficult conditions.
Common Mistakes Traders Make with Each Analysis Method
Common trading mistakes include over-relying on one method, ignoring fundamentals during major news events, overcomplicating technical setups, and failing to integrate both methods effectively.
- Using Fundamentals to Time Short-Term Trades: Knowing a stock is undervalued doesn't mean it rises tomorrow. Use fundamentals for direction, technicals for timing.
- Ignoring Scheduled Fundamental Events: Technical setups fail when Fed announcements cause reversals. Always know when major events are scheduled.
- Over-Complicating Technical Analysis: Using ten indicators creates analysis paralysis. Mastering two or three tools (price action plus one trend and one momentum indicator) typically suffices.
- Thinking One Method Guarantees Success: Neither method serves as a crystal ball. Focus on risk management regardless of analytical approach.
- Not Adapting to Conditions: Technical patterns perform differently in trending versus ranging markets. Recognize current market conditions and adjust accordingly.
Conclusion: Fundamental Analysis vs Technical Analysis
The core difference between fundamental analysis vs technical analysis for traders lies in application: fundamentals determine what to trade and directional bias; technicals determine when to trade and where to enter and exit. For most active traders, combining both methods, i.e. using fundamentals for conviction and technicals for execution, provides a comprehensive approach.
Neither method predicts the future with certainty; both serve as tools for improving decision-making. Match your analysis approach to your trading style: scalpers and day traders lean heavily technical, while swing and position traders benefit from integrating both methods.
Regardless of which analysis method you emphasize, risk management remains essential. Position sizing and stop-losses protect trading capital independent of analytical accuracy. The traders who succeed long-term typically learn to use each method where it provides value, while prioritizing capital preservation over prediction accuracy.

FAQ
Risk disclaimer: CFDs are complex instruments and come with a high risk of losing money rapidly due to leverage. You should consider whether you understand how CFDs work and whether you can afford to take the high risk of losing your money. Never deposit more than you are prepared to lose. Professional client’s losses can exceed their deposit. Please see our risk warning policy and seek independent professional advice if you do not fully understand. This information is not directed or intended for distribution to or use by residents of certain countries/jurisdictions including, but not limited to, USA & Countries included in the OFAC sanction list. The Company holds the right to alter the aforementioned list of countries at its own discretion.
TIOmarkets offers an exclusively execution-only service. The views expressed are for information purposes only. None of the content provided constitutes any form of investment advice. The comments are made available purely for educational and marketing purposes and do NOT constitute advice or investment recommendation (and should not be considered as such) and do not in any way constitute an invitation to acquire any financial instrument or product. TIOmarkets and its affiliates and consultants are not liable for any damages that may be caused by individual comments or statements by TIOmarkets analysis and assumes no liability with respect to the completeness and correctness of the content presented. The investor is solely responsible for the risk of his/her investment decisions. The analyses and comments presented do not include any consideration of your personal investment objectives, financial circumstances, or needs. The content has not been prepared in accordance with any legal requirements for financial analysis and must, therefore, be viewed by the reader as marketing information. TIOmarkets prohibits duplication or publication without explicit approval.
Join us on social media



Authors BIO

Maria is a writer and content strategist with over 10 years of experience in the finance industry. She specializes in developing research-backed articles that help financial professionals navigate complex market topics with confidence. Her expertise spans forex, stocks, CFDs and global markets, creating insightful content that educates readers and supports informed decision-making.





