


SMC Trading: Practical Smart Money Concepts Guide
BY Eleni Antoniou
|September 3, 2026SMC trading is a price-action framework that organizes a chart around market structure, liquidity, displacement, order blocks and fair value gaps. The aim is to form a testable view of where price may seek orders and where that view becomes invalid. It does not reveal institutional positions, guarantee a reversal or remove the need for risk management.
This guide explains smart money concepts in plain English and shows how traders can turn the vocabulary into consistent rules. You will also learn what SMC cannot tell you, how to test an SMC trading strategy and which common mistakes can make a chart look clearer in hindsight than it was in real time.
Keep reading to learn all about it.
Key takeaways for SMC trading
- SMC is a way of interpreting price action, not a window into a bank's order book.
- Market structure provides direction; liquidity identifies areas of interest; displacement, fair value gaps and order blocks help describe how price moved.
- A liquidity sweep, break of structure or order block is not a complete trade signal on its own.
- Definitions vary between SMC educators. Write objective rules for swing points, candle closes, zones and invalidation before testing a strategy.
- Historical testing should include spreads, commission, slippage assumptions and every valid setup, including losses.
- Leveraged trading can amplify losses. Position sizing and a predefined exit matter more than any chart label.
What is SMC trading?
SMC trading, short for Smart Money Concepts trading, is a family of price-action methods used to interpret trends, trading ranges, liquidity and rapid price moves. Practitioners look for recurring chart features that they believe may reflect the activity of large market participants, such as banks, funds and market makers.
The important word is “may.” A candlestick chart shows traded prices over time. By itself, it does not identify who placed an order, why they placed it or whether an apparent order block contains unfilled institutional orders. Smart money concepts therefore provide a framework for forming and testing hypotheses, not proof of institutional intent.
The method overlaps with older technical-analysis ideas, including swing analysis, support and resistance, supply and demand, false breakouts and range equilibrium. SMC packages these observations into a particular vocabulary and often uses a top-down, multi-timeframe process.
How smart money concepts fit together
The clearest way to understand SMC is as a sequence rather than a collection of isolated chart patterns.
- Context: Is price trending, ranging or moving around a major higher-timeframe level?
- Location: Where are obvious swing highs, swing lows, equal highs, equal lows or range boundaries?
- Event: Did price sweep a level, break structure or move with clear displacement?
- Reaction zone: Did the move leave an order block or fair value gap that fits the context?
- Decision: What confirms the idea, what invalidates it and where is the next logical objective?
- Risk: Is the position size appropriate after allowing for the stop distance and trading costs?
This order matters. Marking every imbalance or opposing candle first can fill a chart with zones while providing no coherent reason to take or reject a setup.
Core SMC trading concepts
| Concept | Practical definition | What it may help describe |
| Market structure | The sequence of meaningful swing highs and lows | Trend, range and possible transition |
| Break of structure (BOS) | A break in the direction of the established structure | Possible continuation |
| Change of character (CHoCH) | A break against the established structure | An early warning of change |
| Liquidity pool | An area where orders may cluster, often around visible highs or lows | A potential price objective or reaction area |
| Liquidity sweep | A move through a visible level followed by rejection or return | A failed breakout or stop-triggering event |
| Displacement | A decisive directional move with relatively large candles and limited overlap | Urgency and a possible repricing |
| Fair value gap (FVG) | A three-candle imbalance where candle one and candle three do not overlap across part of the range | An area price moved through quickly |
| Order block | Usually the last opposing candle or small base before a forceful move that breaks structure | A potential reaction zone on a retracement |
| Premium/discount | The upper/lower half of a defined dealing range | Relative location within that range |
Market structure: the foundation of SMC
Market structure is the pattern created by swing highs and swing lows. An uptrend is commonly described by higher highs and higher lows. A downtrend typically forms lower lows and lower highs. When neither sequence is clear, price may be ranging.
Before using these labels, define what counts as a swing. One trader may mark every local turn; another may require several candles on each side of a pivot; a third may use only moves visible on a higher timeframe. All three can produce different readings of the same chart.
A useful rule should be observable in real time. For example, a trader might define a swing high as a high with two lower highs on each side, then require a candle close beyond that swing for a valid break. The exact rule is less important than applying it consistently during testing.

Break of structure versus change of character
In common SMC terminology, a break of structure supports continuation. If an established bullish sequence closes above its prior meaningful high, traders may label that move a bullish BOS. In a bearish sequence, a close below the prior meaningful low may be a bearish BOS.
A change of character describes a break against the prevailing sequence. If price in an uptrend closes below the higher low that had supported the trend, traders may call it a bearish CHoCH. It is an alert that conditions may be changing, not confirmation that a full reversal must follow.
Some communities use “market structure shift” in a similar or more specific way. Because these definitions are not standardized, an SMC trading plan should state:
- which timeframe defines external structure;
- which swings count and which are internal noise;
- whether a wick or candle close confirms a break;
- whether displacement is required; and
- what event cancels the new directional bias.
Liquidity in SMC trading
In market terms, liquidity refers to the ability to transact without causing an excessive price change. In SMC chart analysis, “liquidity” is also used more narrowly for areas where stop orders and breakout orders may be concentrated.
Commonly watched locations include equal highs and lows, prior day or week extremes, obvious swing points, session highs and lows, and the boundaries of a well-defined range. These areas can attract attention because many participants can see them and may place orders nearby.
A liquidity sweep occurs when price trades beyond such a level and then returns. This resembles a false breakout. A wick through a prior high is not automatically bearish, however. Price may consolidate above the level or continue higher. Traders need a rule for rejection, such as a close back inside the range followed by a lower-timeframe structure break.
Liquidity should therefore be treated as a location to observe, not an instruction to enter. The response after price reaches the area supplies the useful information.

Displacement and fair value gaps
Displacement is a forceful price move that covers distance quickly, often with long candle bodies, little overlap and a break of a relevant level. SMC traders use it as evidence that the balance between buyers and sellers has shifted, at least temporarily.
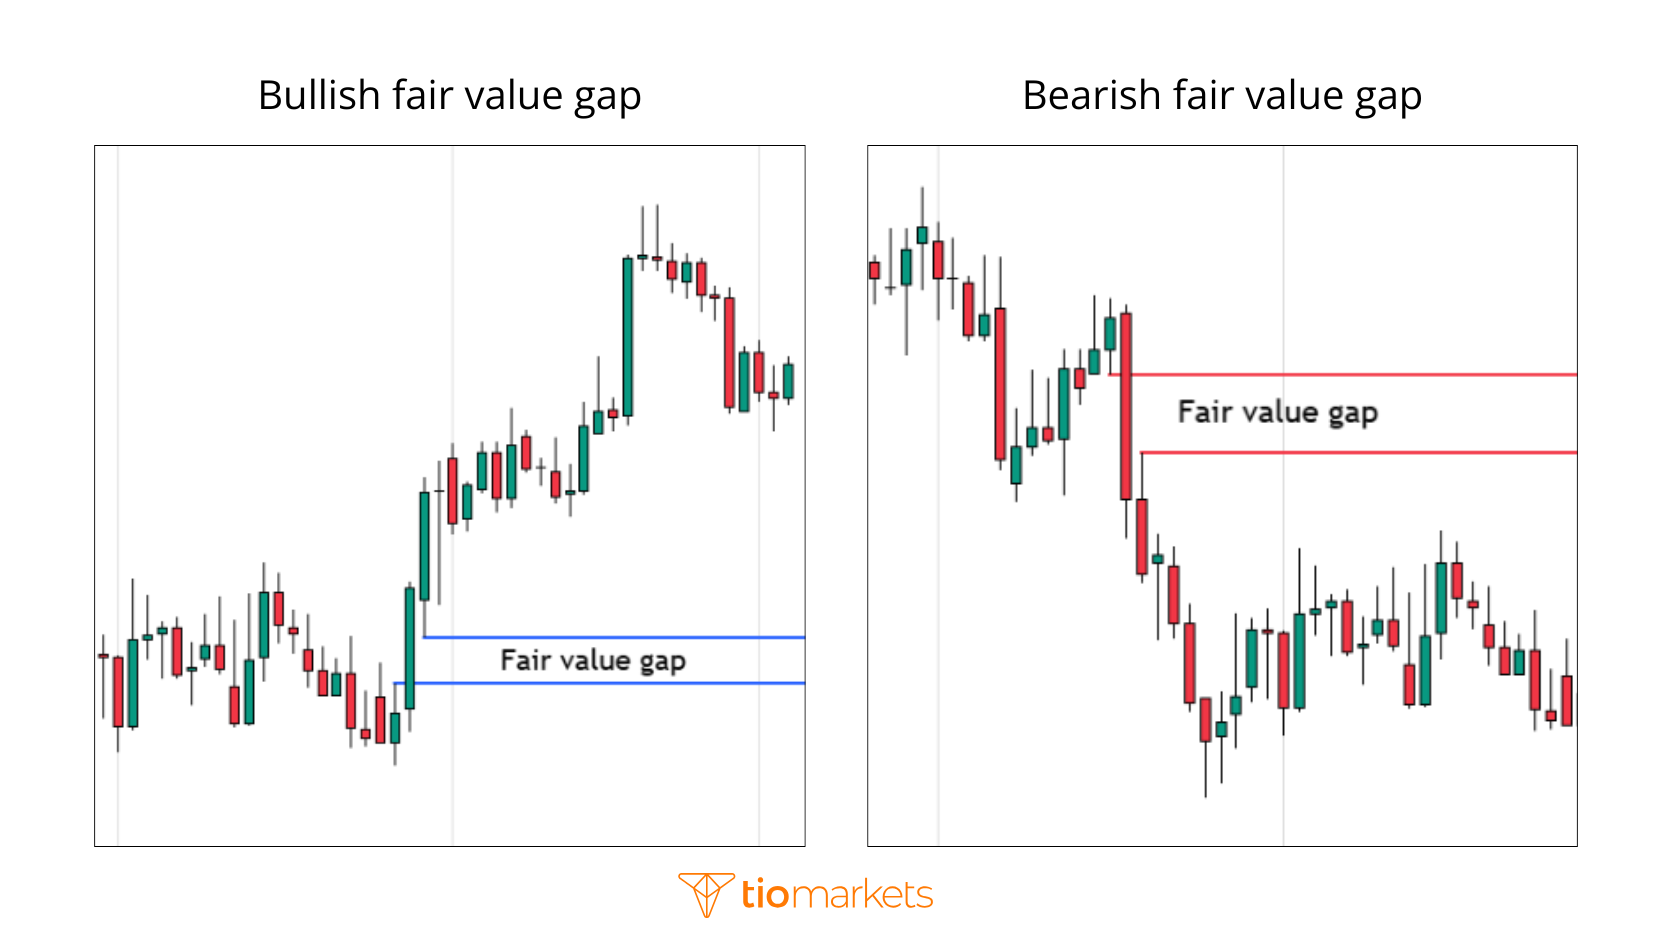
A fair value gap can appear inside that movement. For a bullish FVG, the high of the first candle is below the low of the third candle, leaving a price interval that their wicks do not overlap. For a bearish FVG, the low of the first candle is above the high of the third candle.
Despite the name, an FVG is not necessarily a literal exchange gap and it does not establish an asset's fundamental fair value. It is a visual price imbalance in a three-candle sequence. Price may revisit all, part or none of the zone.
More selective SMC trading rules may only retain gaps that:
- occur with a clear displacement move;
- contribute to a defined structural break;
- align with the higher-timeframe context;
- form after price interacts with mapped liquidity; and
- remain unmitigated before the planned entry.
What is an order block?
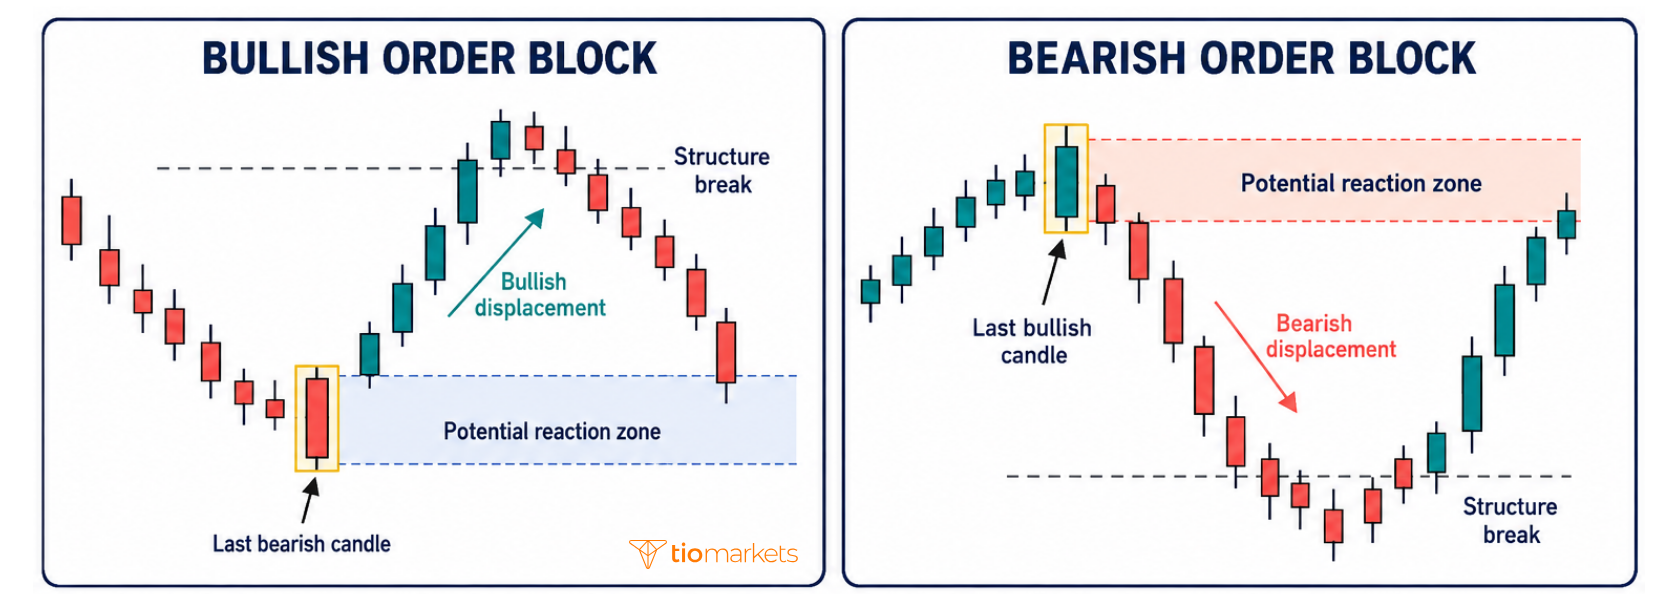
An order block is usually marked as the last candle moving against a strong directional expansion, or the small base immediately before it. A bullish order block is commonly the final bearish candle before a bullish displacement. A bearish order block is commonly the final bullish candle before a bearish displacement.
The label should not be interpreted literally. Standard candlestick data cannot confirm that a particular candle contains a bank's remaining orders. It is more accurate to call an order block a potential reaction zone defined by SMC rules.
To reduce hindsight bias, specify whether the zone uses the full candle range, the body only or a fixed portion of the candle. Then decide what qualifies it. A more structured definition may require the departure to break a meaningful swing, leave an FVG and avoid an immediate close back through the zone.
When price returns, the order block can hold, produce a temporary bounce or fail completely. An invalidation rule, such as a close beyond the far edge, must be defined before entry.
Premium, discount and the dealing range
SMC traders often divide a selected swing low-to-high range at its midpoint. Prices below 50% are called discount and prices above 50% are called premium. In a bullish framework, a trader may focus on potential long setups in discount. In a bearish framework, they may look for potential short setups in premium.
These terms describe relative position, not objective value. A market trading in “discount” is not necessarily cheap in a fundamental sense. Changing the anchor swing also changes the zones, so the dealing range must be selected with a repeatable rule.
A step-by-step SMC trading framework
The following process is an educational template, not a recommendation to trade. Its purpose is to show how individual smart money concepts can become conditional rules.
1. Choose the market and timeframe hierarchy
Select one instrument and decide which timeframe defines context and which timeframe is used for execution. For example, a trader might use a four-hour chart for external structure and a 15-minute chart for detailed confirmation. Test the pairing rather than assuming that lower timeframes always improve entries.
2. Define the higher-timeframe condition
Classify the market as bullish, bearish or ranging using fixed swing rules. Mark only the levels that can change that classification. Check the economic calendar because scheduled news can sharply increase volatility and execution risk.
3. Map relevant liquidity
Mark a limited number of observable levels: major swing points, equal highs or lows, and clear range boundaries. Identify which level would support the scenario and which would invalidate it.
4. Wait for interaction and response
Observe what happens when price reaches the area. Does it sweep the level and close back inside? Does it accelerate through and hold beyond it? Waiting for a response prevents a liquidity label from becoming an automatic countertrend entry.
5. Require a structural trigger
On the execution timeframe, apply the predetermined BOS, CHoCH or market structure shift rule. If the plan requires displacement, define it with measurable features, such as a body larger than a recent average and a close beyond the chosen swing.
6. Mark the reaction zone
Identify the qualifying order block or FVG created by the move. Remove the zone if price has already invalidated or fully traded through it under the strategy's rules.
7. Plan entry, invalidation and objective
Decide whether the method enters on a retracement, waits for a second confirmation or skips the trade if price never returns. Place the invalidation where the original idea is demonstrably wrong, then identify a logical objective such as opposing liquidity. A distant target does not improve a setup if it is unlikely to be reached under the tested rules.
8. Calculate size and record the outcome
Position size should follow from the permitted monetary risk and the distance to invalidation, not from a desired profit. Allow for spread, commission and possible slippage. Record the screenshot, rule checks, costs, outcome and any deviation from the plan.
Hypothetical SMC setup example
Consider a hypothetical currency pair whose four-hour chart has formed higher highs and higher lows. The most recent higher low remains intact, so the predefined higher-timeframe bias is bullish. A cluster of similar lows sits inside the lower half of the selected dealing range.
Price briefly trades below those lows and then closes back above them. On the 15-minute chart, a bullish displacement closes beyond the last defined lower high, satisfying the strategy's change-of-character rule. The move leaves a bullish FVG that overlaps the final bearish candle before displacement.
Under this sample plan, the overlap is a potential area of interest, not an immediate buy signal. The trader would specify in advance:
- the exact retracement condition for entry;
- an invalidation level below the swept low or the defined zone;
- the next opposing liquidity area as a possible objective;
- the maximum permitted monetary loss; and
- a cancellation rule if price reaches the objective without retracing.
The setup can still fail. Price could close through the zone, spreads could widen or a news release could cause slippage. That losing outcome belongs in the test sample just as much as a clean reaction does.
SMC versus traditional technical analysis
SMC trading is sometimes presented as the opposite of traditional technical analysis, but the divide is not absolute.
| Area | SMC approach | Traditional technical-analysis approach |
| Trend | Swing structure, BOS and CHoCH | Trendlines, moving averages and chart patterns |
| Key levels | Liquidity pools, order blocks and FVGs | Support, resistance, supply and demand |
| Entry timing | Sweep, displacement and retracement | Breakout, pullback, indicator or candlestick confirmation |
| Main strength | A narrative connecting context, location and trigger | Widely understood tools with many ways to quantify them |
| Main risk | Subjective labels and hindsight bias | Lagging or over-optimized signals |
The approaches can coexist. A trader might use market structure for context, an SMC liquidity event for location and volatility or volume data as a filter. Every additional condition should have a defined purpose and be tested; more confluence does not automatically mean a better strategy.
Does SMC trading work?
SMC trading can be organized into a strategy, but the label alone does not establish a profitable edge. Results depend on the exact definitions, market, timeframe, execution, costs, risk controls and test period. Two traders who both claim to use smart money concepts may follow materially different rules.
There is also a verification problem. After a move has happened, it is easy to select the swing that makes a BOS obvious, retain the order block that held and ignore the zones that failed. This is hindsight bias, not evidence that the method works.
A fair evaluation requires rules that another person could apply to the same historical chart without seeing future candles. Test all qualifying examples over different market conditions, keep out-of-sample data for validation and compare the results with a simple benchmark. Positive historical results still do not guarantee future performance.
How to backtest an SMC strategy
Start with the smallest complete rule set. Testing every SMC term at once makes it difficult to identify what contributes value.
- Write exact definitions for swings, BOS or CHoCH, sweeps, order blocks and FVGs.
- Specify the instrument, session and timeframe before collecting examples.
- Define entry, cancellation, stop, exit and position-sizing rules.
- Replay the chart candle by candle so future price is hidden.
- Include every valid setup and log spread, commission and a realistic slippage assumption.
- Separate development data from unseen validation data.
- Track more than win rate, including average gain, average loss, maximum drawdown, losing streak and expectancy after costs.
- Review whether small rule changes cause results to collapse, which may indicate overfitting.
A demo account can help test platform execution and practise following rules without risking real funds. Demo performance can differ from live trading because simulated execution and the absence of financial pressure change the experience. Explore the TIOmarkets demo account after you have written the rules you intend to practise.
Risk management for SMC trading
No amount of confluence makes a trade certain. Risk control begins with an invalidation level, but it should also address position size, total exposure, correlation, trading costs and event risk.
Use these principles as planning prompts:
- Risk first: Determine the maximum acceptable loss before calculating position size.
- Use structural invalidation: Place the exit where the setup's logic fails, then reduce size if that distance creates too much exposure.
- Allow for execution: Stop orders may fill at a worse price during fast or illiquid conditions.
- Check combined exposure: Several positions linked to the same currency or market theme can behave like one larger trade.
- Do not widen a stop impulsively: Changing invalidation after entry changes the original plan and increases potential loss.
- Pause around major events when required by the plan: News can override short-term technical structure and widen spreads.
Leverage magnifies both gains and losses. CFDs are complex leveraged instruments and carry a high risk of losing money rapidly. Consider whether you understand how they work and whether you can afford the risk.
Common SMC trading mistakes
Treating every zone as institutional proof
Order blocks and FVGs are chart annotations. Describe them as potential areas of interest and judge them with predefined rules rather than claiming to know which institution traded there.
Changing swing points after the outcome
If the chosen structure only becomes obvious after price moves, the rule is not reproducible. Lock the pivot method and timeframe before testing.
Entering on a sweep alone
A move beyond a visible high or low may continue. Require the response specified in the plan instead of assuming every sweep must reverse.
Assuming every fair value gap will fill
Some gaps are revisited quickly, some much later and some not within the relevant holding period. “Unfilled” is not the same as “guaranteed target.”
Using very low timeframes without costs
Small theoretical stops can make spreads, commission and slippage a large share of the planned risk. Test net results, not ideal chart prices.
Collecting confluence without clear rules
Adding a Fibonacci level, session label, order block and indicator can create confidence without adding measurable value. Each condition should change a decision and survive testing.
Risking more after recent losses
Increasing size to recover a drawdown can compound losses. A consistent risk policy helps keep one trade or sequence from dominating the account. TIOmarkets' overview of common forex trading mistakes covers related planning and execution errors.
SMC glossary
- BOS: Break of structure; commonly a continuation break in the direction of the established trend.
- CHoCH: Change of character; commonly an early structural break against the previous trend.
- Dealing range: The selected swing high-to-low interval used to assess premium, discount and equilibrium.
- Displacement: A rapid directional move with relatively strong candles and limited overlap.
- Equilibrium: The midpoint of the selected dealing range.
- FVG: Fair value gap; a three-candle price imbalance defined by non-overlapping portions of candles one and three.
- Inducement: An SMC interpretation of a visible level that may attract traders or orders before a larger move.
- Mitigation: A return to a previously marked zone, interpreted by practitioners as price revisiting an area of prior activity.
- Order block: A rule-defined candle or base before a strong move, treated as a potential reaction zone.
- Sweep: A move through a visible liquidity level followed by a return or rejection under defined rules.

FAQ
Risk disclaimer: CFDs are complex instruments and come with a high risk of losing money rapidly due to leverage. You should consider whether you understand how CFDs work and whether you can afford to take the high risk of losing your money. Never deposit more than you are prepared to lose. Professional client’s losses can exceed their deposit. Please see our risk warning policy and seek independent professional advice if you do not fully understand. This information is not directed or intended for distribution to or use by residents of certain countries/jurisdictions including, but not limited to, USA & Countries included in the OFAC sanction list. The Company holds the right to alter the aforementioned list of countries at its own discretion.
TIOmarkets offers an exclusively execution-only service. The views expressed are for information purposes only. None of the content provided constitutes any form of investment advice. The comments are made available purely for educational and marketing purposes and do NOT constitute advice or investment recommendation (and should not be considered as such) and do not in any way constitute an invitation to acquire any financial instrument or product. TIOmarkets and its affiliates and consultants are not liable for any damages that may be caused by individual comments or statements by TIOmarkets analysis and assumes no liability with respect to the completeness and correctness of the content presented. The investor is solely responsible for the risk of his/her investment decisions. The analyses and comments presented do not include any consideration of your personal investment objectives, financial circumstances, or needs. The content has not been prepared in accordance with any legal requirements for financial analysis and must, therefore, be viewed by the reader as marketing information. TIOmarkets prohibits duplication or publication without explicit approval.
Join us on social media



Authors BIO

Eleni is a financial markets enthusiast contributing to content covering forex, indices, commodities, and global market developments. She is passionate about researching market-related topics and helping make financial information more accessible to traders.





