


What Is the Terminal Rate? How Rate Hike Cycles End
BY TIOmarkets
|November 16, 2026The terminal rate is the level at which a central bank's policy rate is expected to peak in a rate hike cycle, before the bank holds and later cuts. That terminal rate definition carries a caveat: a quoted figure is not a forecast of the peak. Market pricing blends possible paths and adds a risk premium, while an official projection is a median conditional on policymakers' own economic forecasts.
This article explains how futures, swaps, the Federal Reserve's dot plot and Bank of England projections each estimate the peak, and why changes in those estimates move EUR/USD and GBP/USD, for forex traders who follow central bank decisions.
What Is the Terminal Rate?
In a tightening cycle, a central bank raises its policy rate in steps, often of 25 basis points (0.25 percentage points). In market usage, the terminal rate meaning is the top of that sequence: the peak interest rate at which hikes stop and a plateau begins. The plateau's height and length together set the average rate expected over the next two years, which is what short-dated bonds price.
In a hypothetical cycle, four 25 basis point hikes take a policy rate from 3.00% to 4.00%. If new data lead markets to price a fifth, the expected terminal interest rate becomes 4.25% and every later expected rate rises with it. A repriced peak can therefore move two-year yields more than a decision markets had already priced.
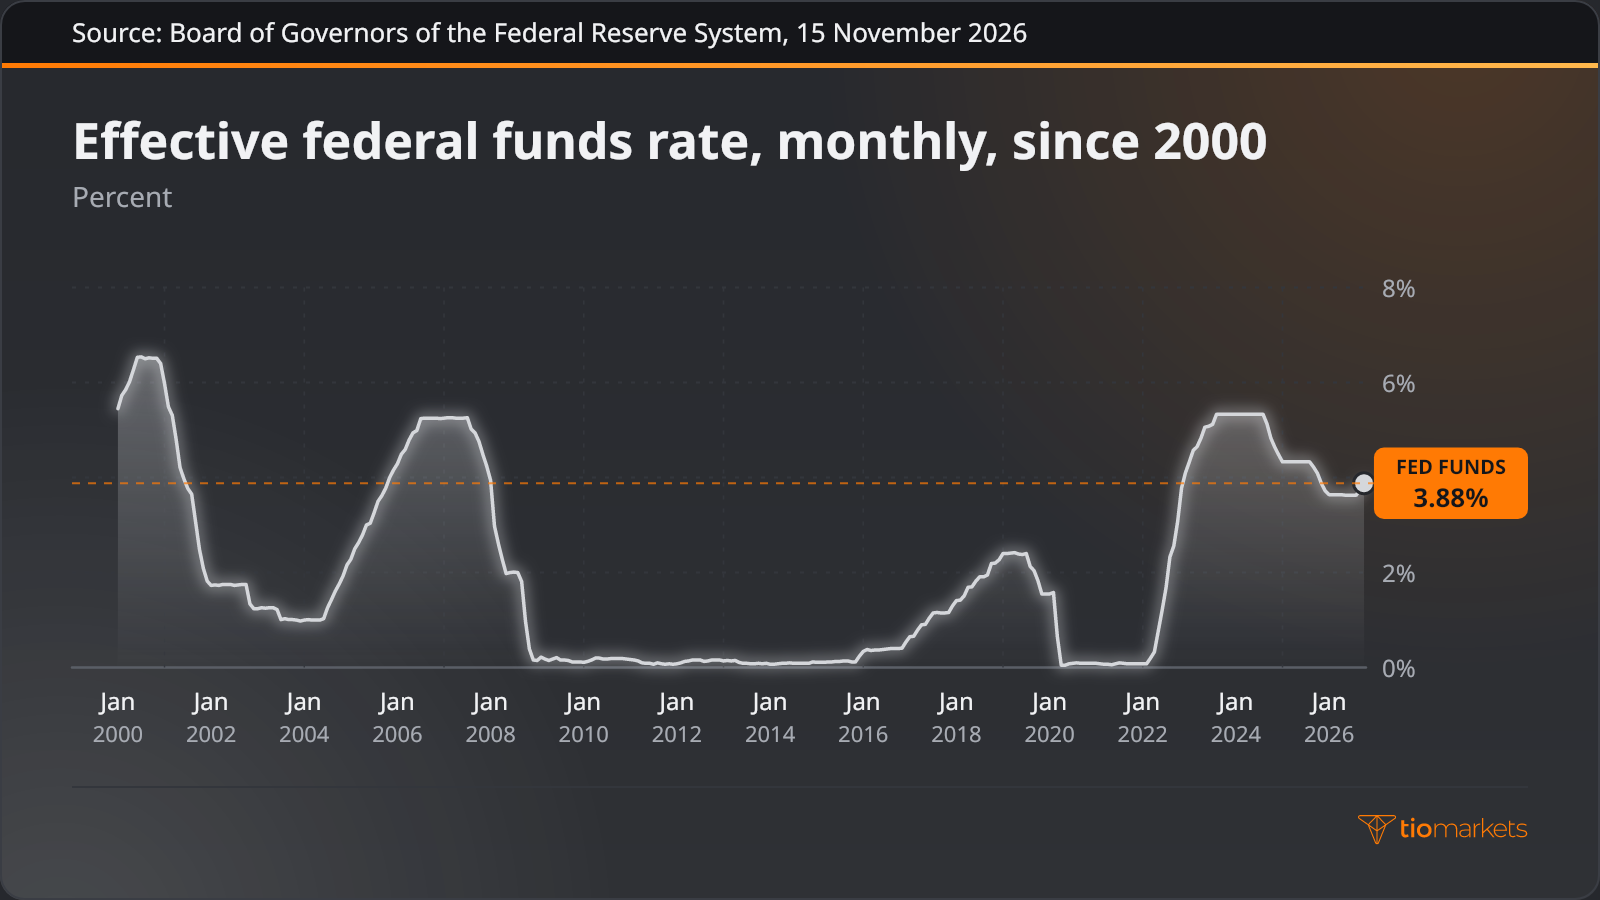
The effective federal funds rate, the overnight rate at which US banks lend reserves to one another, shows the shape of completed cycles: a climb in steps, a flat stretch at the top, then a decline. Each of those plateaus was only an estimate until it was reached.
Terminal Rate vs Neutral Rate
The neutral rate (r-star), also written r*, is the theoretical real interest rate that would prevail once maximum employment and 2% inflation are reached. It cannot be observed. Market participants often read the longer-run median of the Federal Open Market Committee (FOMC) rate projections as a nominal counterpart: 3.2% in September 2026, against 3.1% in June.
A terminal rate belongs to one cycle, and in a restrictive cycle it sits above neutral by design so that policy restrains demand. In the September 2026 projections, the median for end-2026 was 4.1%, 0.9 percentage points above the longer-run median. The two are confused because both are called the level where rates settle, yet one is a temporary peak and the other the level policy returns to once restraint ends.
How Markets Price the Peak of a Rate Hike Cycle
Four sources estimate the peak policy rate. Rate futures and overnight index swaps (OIS), which exchange a fixed rate for the realised overnight rate, give a market-implied terminal rate; in the US, 30-day fed funds futures and SOFR futures show the terminal fed funds rate that traders price. Central bank projections give a median path. The Taylor rule, a formula linking the policy rate to inflation and output gaps, needs an assumed neutral rate. Economist surveys give a periodic consensus. Each draws on different evidence, so terminal rate pricing and official projections often disagree:
| What the chart or market shows | The approach traders use for it | Main risk |
| Futures or OIS strip rises, then flattens at a peak | Market-implied peak read from the strip's highest point | Term premium and probability weighting distort the level |
| Dot plot median sits above market pricing | Official projection read as the committee's conditional median path | Projections depend on forecasts and are not commitments |
| Inflation above target while growth holds up | Taylor rule estimate from the inflation and output gaps | Rests on an unobservable neutral rate and chosen weights |
| Survey of economists clusters around one level | Consensus estimate set against market pricing | Collected periodically, so it can be stale after new data |
How Is the Terminal Rate Calculated From Futures?
Fed funds futures have traded on the Chicago Mercantile Exchange since 1988 under the International Monetary Market (IMM) convention: the price is 100 minus the arithmetic average of the daily effective federal funds rate over the contract month. The price falls as the expected rate rises, as a bond price does; 95.6725 corresponds to an average rate of 4.3275%.
Knowing how to calculate implied terminal rate levels needs one correction. A mid-month decision moves only part of the monthly average, so the change is scaled by the inverse of the share of days left after the announcement. In a hypothetical 30-day month with a decision on day 15, a 12.5 basis point rise in that month's implied rate means a 25 basis point hike is priced.
Reading an implied peak from a strip of contracts takes five steps:
- Select consecutive monthly contracts that cover the central bank's scheduled meetings.
- Convert each price to an implied rate by subtracting it from 100.
- Apply the averaging correction to meeting months, and treat the first full month after each meeting as a clean post-meeting reading.
- Identify the highest implied rate in the strip: that level is the market-implied peak.
- Subtract the current effective rate to express the priced tightening in basis points.
The result is a price rather than a forecast, since it averages scenarios and includes term premium. A hypothetical strip, with the effective rate at 4.10%, shows the arithmetic:
| Contract month (hypothetical) | Price | Implied rate (%) | Above current 4.10% (bp) |
| Month 1 | 95.90 | 4.10 | 0 |
| Month 2 | 95.78 | 4.22 | 12 |
| Month 3 | 95.67 | 4.33 | 23 |
| Month 4 | 95.65 | 4.35 | 25 |
| Month 5 | 95.70 | 4.30 | 20 |
The strip peaks at 4.35% in month 4, 25 basis points above the current rate, the equivalent of one full hike. The lower rate in month 5 shows some probability attached to a cut after the plateau.
Fed Dot Plot Terminal Rate and BoE Projections
The Federal Reserve has published individual projections in its semiannual Monetary Policy Report to Congress since 1979, as the Humphrey-Hawkins Act of October 1978 requires, and introduced the Summary of Economic Projections (SEP) in 2007. From January 2012, participants also submitted the federal funds rate path they judged appropriate. The resulting dot plot, meant to increase transparency, appears each March, June, September and December.
Reading the dot plot for an implied peak takes four steps:
- Locate the dots for each year-end; each is the midpoint of one participant's appropriate target range.
- Find the median: with 18 participants, the average of the ninth and tenth dots in ascending order.
- Take the highest year-end median as the committee's implied peak, and check dispersion through the central tendency and range.
- Set the median against market pricing for the same year-end.
These rate projections are not forecasts of the most likely quarterly outcomes. In September 2026, 12 of 18 participants placed their 2026 dot at 4.125%, 4 at 4.375% and 2 at 3.875%, a median of 4.125%, published as 4.1. The 2027 median was also 4.1, though its range of 3.1–4.4 was wider than the 3.9–4.4 for 2026. June's medians had been 3.8 for 2026 and 3.6 for 2027, so by the September 2026 Fed meeting the implied peak had risen 0.3 percentage points and the plateau extended to end-2027.
The Bank of England's November 2023 Monetary Policy Report worked differently: it conditioned the Monetary Policy Committee's projections on a market-implied path for Bank Rate that stayed around 5¼% until 2024 Q3, then fell gradually to 4¼% by the end of 2026. In that report, BoE terminal rate market pricing was an input to the forecast, and the Committee's view showed in how its projections and forward guidance responded. Futures weight each path by its probability and add a risk premium, whereas a dot plot median aggregates conditional judgements, so the two need not coincide.
How Terminal Rate Affects Currencies and Bond Yields
The link between the terminal rate and bond yields runs through the front of the curve. The 2-year Treasury yield reflects the average policy rate expected over two years plus a term premium, the extra compensation for holding rate risk longer, so a higher or longer peak lifts it. Pricing a high peak followed by cuts can push the 2-year yield above the 10-year yield, a yield curve inversion.
Currency markets compare such yields across borders. The rate differential, the gap between two economies' short-term yields, shapes flows between their currencies, so EUR/USD and GBP/USD set Fed expectations against those for the ECB and the BoE. At the November 2026 BoE decision, the Monetary Policy Committee voted 8–1 to raise Bank Rate by 0.25 percentage points to 4%. The ECB deposit facility rate, through which the Governing Council decided in March 2024 to keep steering policy, has been 2.50% since 16 September 2026, following the September 2026 ECB decision.
Through this channel, it is the change in the differential, not the level of either peak, that moves EUR/USD or GBP/USD. If both implied peaks rise 25 basis points, the gap is unchanged. In a hypothetical case where only the Fed's rises 25 basis points, lifting US 2-year yields by the same amount while UK yields stay flat, the gap widens 25 basis points in the dollar's favour: other things equal, downward pressure on GBP/USD, which growth data, risk sentiment or positioning can outweigh. How CPI affects currencies depends partly on what a surprise does to the expected peak.
Common Mistakes When Reading a Peak Policy Rate
Four mistakes recur when traders read an expected peak, and each comes from treating an estimate as a settled number:
- Reading market pricing as a forecast. With hypothetical equal odds on peaks of 4.00% and 4.50%, futures price roughly 4.25%, a level neither scenario expects.
- Ignoring term premium. Longer-dated contracts carry compensation for uncertainty, so the far end of a strip can sit above the expected path.
- Treating dot plots as promises. Each dot moves when its author's projections change, as the medians did between June and September 2026.
- Ignoring how long the rate stays at its peak. Two cycles with the same peak imply different average rates, and different yields, if one plateau lasts longer.
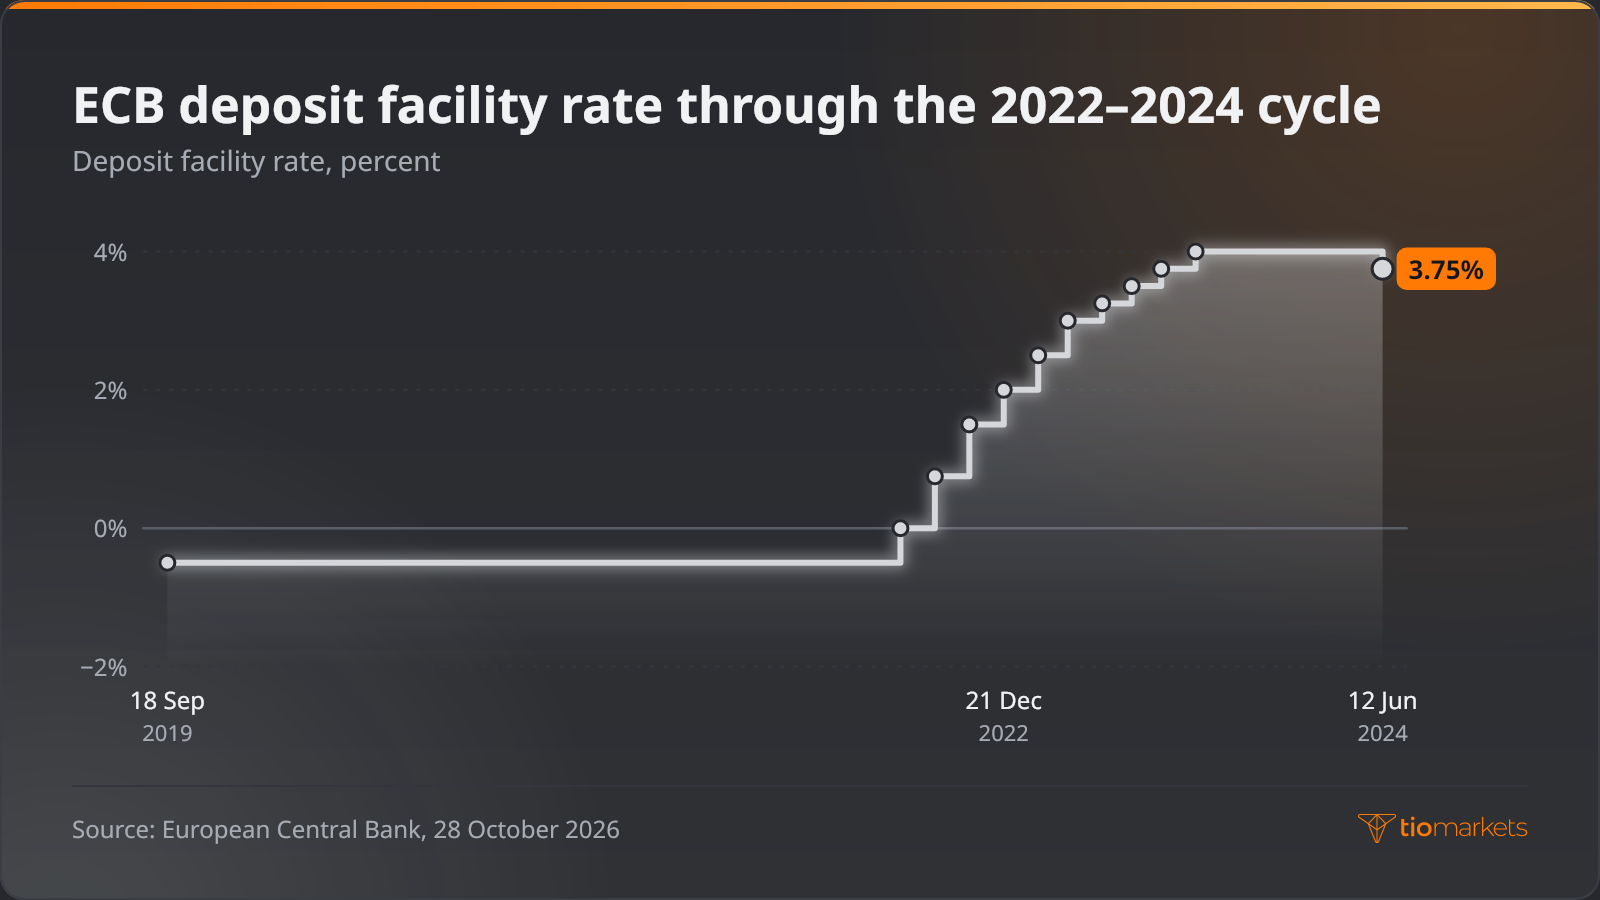
The ECB's last full cycle shows why duration matters. The deposit facility rate rose from −0.50% to 0.00% on 27 July 2022, reached 4.00% on 20 September 2023 after ten increases, and held there until a cut to 3.75% on 12 June 2024. That plateau of almost nine months was a separate variable from the peak level.
Repricing events such as a policy decision, an SEP release or an inflation surprise can move currency pairs abruptly, and orders may then be filled at worse prices than requested, known as slippage. Traders who speculate on EUR/USD or GBP/USD through contracts for difference (CFDs), which track price moves without ownership of the asset, use leverage: a margin deposit opens a much larger position. Leverage magnifies losses exactly as it magnifies gains, a sudden repricing of the expected peak can produce losses quickly, and a trader can lose all the money deposited.
Conclusion
For a currency trader, an expected peak is more usefully read as a moving estimate with known biases than as a destination. Futures and swaps blend scenarios and add a premium; dot plots and BoE projections are conditional statements revised at each release. The information lies in the revisions, above all in one central bank's expected peak relative to another's, because those shift the 2-year yield gap behind EUR/USD and GBP/USD.
The approach has limits: an implied peak says nothing certain about when cuts begin, a rate differential is one of several influences on an exchange rate, and estimates can move abruptly after one data release. For traders who act on those moves with leveraged products, leverage enlarges losses just as it enlarges gains, losses can mount rapidly when pricing shifts, and the entire deposit can be lost.
Trade EUR/USD and GBP/USD with TIOmarkets
Take your position on global markets via CFDs. Enjoy tight spreads, fast execution, and fast, flexible funding options.
Trading is risky
FAQ
Risk disclaimer: CFDs are complex instruments and come with a high risk of losing money rapidly due to leverage. You should consider whether you understand how CFDs work and whether you can afford to take the high risk of losing your money. Never deposit more than you are prepared to lose. Professional client’s losses can exceed their deposit. Please see our risk warning policy and seek independent professional advice if you do not fully understand. This information is not directed or intended for distribution to or use by residents of certain countries/jurisdictions including, but not limited to, USA & Countries included in the OFAC sanction list. The Company holds the right to alter the aforementioned list of countries at its own discretion.
TIOmarkets offers an exclusively execution-only service. The views expressed are for information purposes only. None of the content provided constitutes any form of investment advice. The comments are made available purely for educational and marketing purposes and do NOT constitute advice or investment recommendation (and should not be considered as such) and do not in any way constitute an invitation to acquire any financial instrument or product. TIOmarkets and its affiliates and consultants are not liable for any damages that may be caused by individual comments or statements by TIOmarkets analysis and assumes no liability with respect to the completeness and correctness of the content presented. The investor is solely responsible for the risk of his/her investment decisions. The analyses and comments presented do not include any consideration of your personal investment objectives, financial circumstances, or needs. The content has not been prepared in accordance with any legal requirements for financial analysis and must, therefore, be viewed by the reader as marketing information. TIOmarkets prohibits duplication or publication without explicit approval.
Join us on social media


Authors BIO

Behind every blog post lies the combined experience of the people working at TIOmarkets. We are a team of dedicated industry professionals and financial markets enthusiasts committed to providing you with trading education and financial markets commentary. Our goal is to help empower you with the knowledge you need to trade in the markets effectively.





