



Best Timeframes for Forex Trading: The Complete Guide to Choosing Your Optimal Chart Period
BY Maria K.
|July 23, 2026How does it even make sense when a trader develops a proven strategy, executes it consistently, yet struggles to achieve stable results? The issue often isn't the strategy itself but timeframe selection. Forex chart timeframes represent one of the most overlooked yet impactful decisions in currency trading.
The best timeframes for forex trading depend on your strategy, schedule, and risk tolerance. Scalpers typically use 1–5 minute charts, day traders work with 15-minute to 1-hour charts, swing traders prefer 4-hour to daily charts, and position traders use weekly or monthly charts. Some traders combine two or three timeframes using a top-down analysis approach.
This guide examines every major timeframe, how to match them to specific trading styles, and a practical framework for identifying your optimal trading period.
What Is a Timeframe in Forex Trading? Why It Matters More Than Traders Realize
A timeframe refers to the duration each candlestick or bar represents on a price chart. A 1-minute chart produces 1,440 candles per trading day, while a daily chart generates just one candle per day. Timeframes function as a "zoom lens"- the same market activity appears completely different depending on the perspective selected.
How Timeframe Selection Affects Every Part of Your Trade
The chosen forex time frame analysis impacts virtually every aspect of trading execution. Signal quality and noise levels shift dramatically between short and long chart periods. Stop-loss size and placement requirements change proportionally with the timeframe selected. Risk-to-reward ratios, trade frequency, and required screen time all correlate directly with this single decision.
Psychological demands and stress levels increase substantially on shorter timeframes. Spread and execution costs become particularly relevant when targeting small price movements. The same EUR/USD price action that appears chaotic on a 5-minute chart often reveals clear directional trends on a daily chart - illustrating why timeframe selection serves as a foundational trading decision.
Complete Forex Timeframe Spectrum, Tick Charts to Monthly Views
Understanding the full range of available forex trading time periods helps traders identify where their approach fits within the broader spectrum.
| Timeframes | Typical Trader Type | Signal Quality | Screen Time Required |
| Tick, 1-min, 5-min | Scalpers | Low (high noise) | Constant |
| 15-min, 30-min | Day traders | Moderate | High |
| 1-hour, 4-hour | Day/Swing traders | Good | Moderate |
| Daily, Weekly | Swing/Position traders | High | Low |
| Monthly | Position traders | Very High | Minimal |
Why More Candles Does Not Always Mean More Opportunity
Short-term forex timeframes generate substantially more signals, but the majority tend to be false positives created by market noise. Higher timeframes filter out this noise and typically produce setups with greater statistical reliability, though they require considerably more patience. The fundamental trade-off exists between signal frequency and signal quality.
Best Forex Trading Timeframes by Trading Style - Matched to How You Actually Trade
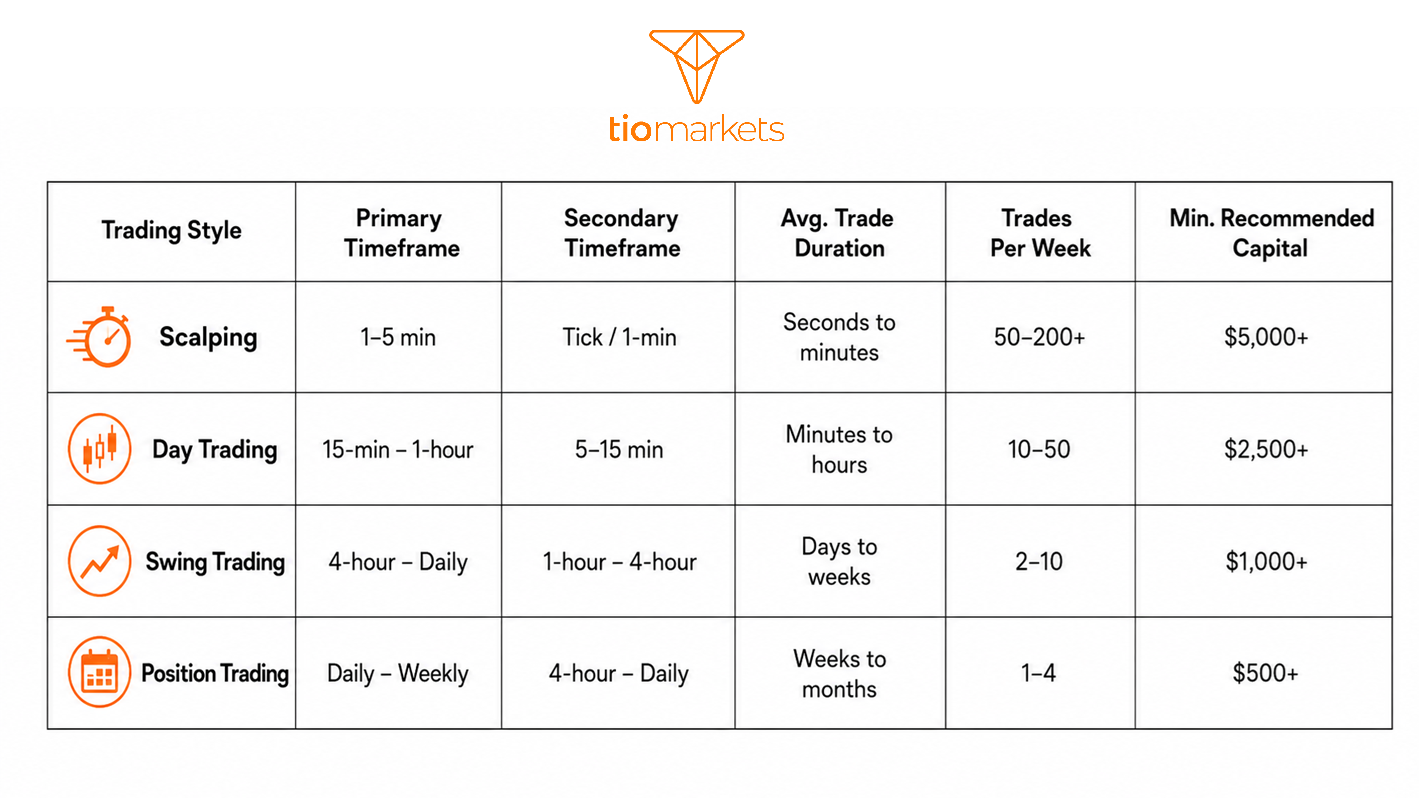
Different trading styles require different timeframes. The following breakdown matches each major approach, scalping, day trading, swing trading, and position trading, with its corresponding optimal chart periods.
Best Timeframes for Scalping Forex (1-Minute to 5-Minute Charts)
Scalping involves exploiting small price movements through high-frequency trading with very short holding periods measured in seconds to minutes. The 1-minute and 5-minute charts serve as the scalper's primary workspace, with the 5-minute chart often proving most practical due to its balance between detail and reduced noise compared to 1-minute views.
Best Timeframes for Day Traders (15-Minute to 1-Hour Charts)
Day trading requires all positions to be opened and closed within a single trading session. The 15-minute chart provides sufficient detail for identifying intraday trends and short-term entry timing. Many day traders consider the 1-hour chart the "sweet spot"—offering enough context while maintaining a manageable pace.
Best Timeframes for Swing Trading Forex (4-Hour to Daily Charts)
Swing trading captures price movements over days to weeks rather than hours. The 4-hour chart ranks among the most popular timeframes for this approach, while many consider the daily chart the gold standard for swing trade setups due to cleaner patterns, reduced noise, and more defined support and resistance levels.
Best Timeframes for Position Traders (Daily, Weekly, Monthly Charts)
Position trading involves holding trades for weeks, months, or occasionally longer. Weekly and monthly charts facilitate macro trend identification and major support/resistance level analysis. Fundamental analysis typically plays a larger role alongside technical analysis at these long-term forex chart periods.
Best Forex Timeframes for Beginners: Where to Start Without Overwhelming Yourself
Beginning traders often gravitate toward 1-minute or 5-minute charts, drawn by the apparent action and opportunity frequency. However, these ultra-short timeframes present significant challenges: high noise levels, intense emotional pressure, and rapid loss accumulation that can deplete both capital and confidence before skills develop.
The recommended starting point for most beginners falls in the 1-hour to 4-hour range - what might be called the "Goldilocks zone" for learning. These optimal trading periods for forex newcomers provide sufficient time to analyze and think before acting. Chart patterns appear more clearly and reliably at these timeframes. Stop-loss sizes remain manageable, and mistakes tend to be more recoverable since price often provides second opportunities.
Spending 3–6 months on 1-hour and 4-hour charts before experimenting with other timeframes allows pattern recognition skills to develop more efficiently. Demo trading at these timeframes builds familiarity with how price moves without risking real capital during the learning phase.
How to Use Multiple Timeframe Analysis in Forex - Top-Down Approach Explained
Multiple timeframe analysis (MTFA) forex involves examining the same currency pair across two to four timeframes simultaneously. Professional traders employ this technique because higher timeframes provide directional context while lower timeframes enable precise entry timing.
The top-down timeframe analysis process follows three steps:
- Macro Trend (Weekly/Daily): Identify the dominant trend direction and major support/resistance zones that will influence price behavior.
- Setup Identification (4-Hour/1-Hour): Search for price patterns, momentum signals, and potential trade setups that align with the macro trend direction established in step one.
- Entry Timing (15-Minute/30-Minute): Pinpoint precise entry points while setting specific stop-loss and profit target levels.
A common guideline suggests using a 1:4 or 1:6 ratio between timeframes—if the primary analysis occurs on the 4-hour chart, the entry timeframe would be the 1-hour; if primary analysis uses daily charts, entry timing shifts to 4-hour charts.
This approach helps filter false signals and may improve consistency by ensuring trades align with higher timeframe momentum. When signals converge across multiple timeframes—a concept called "timeframe confluence"—the statistical probability of trade success tends to increase. For example, a EUR/USD swing trade might use the daily chart to confirm an uptrend, the 4-hour chart to identify a pullback entry pattern, and the 1-hour chart to time the specific entry point.
Timeframe Selection and Risk Management - The Connection Most Traders Ignore
Timeframe choice directly determines appropriate stop-loss size, which subsequently affects position sizing and risk per trade. Stop-losses must be placed outside the normal "noise range" of the chosen timeframe, a 10-pip stop on a daily chart will likely trigger from routine price fluctuations.
Spread and commission costs impact profitability disproportionately on shorter timeframes. A 2-pip spread on a 5-pip profit target represents 40% of potential gains. Shorter timeframes also tempt traders toward excessive leverage since individual moves appear small—a primary factor in account failures. Swing and position traders face different challenges, including overnight gap risk requiring wider stops.
How Forex Trading Sessions Affect Optimal Timeframe Choice
Liquidity levels fluctuate dramatically throughout the 24-hour forex trading cycle, directly affecting which timeframe to trade forex during different periods. Low-liquidity conditions widen spreads and create erratic price movements that make short-timeframe trading particularly unreliable.
The four major forex trading session timeframes and their characteristics:
- Sydney Session (5 PM – 2 AM EST): Generally low liquidity with limited volatility, conditions are unfavorable for scalping approaches
- Tokyo/Asian Session (7 PM – 4 AM EST): Moderate liquidity for JPY pairs; range-bound price behavior is common
- London Session (3 AM – 12 PM EST): Highest liquidity for EUR and GBP pairs; favorable conditions for 15-minute to 4-hour trading
- New York Session (8 AM – 5 PM EST): High liquidity; overlaps with London from 8 AM–12 PM for peak volatility
The London-New York overlap (8 AM – 12 PM EST) represents the most favored window for short-timeframe trading due to maximum liquidity and tighter spreads.
Common Forex Timeframe Mistakes & How to Avoid Them
- Timeframe hopping after entry. Switching charts after opening a position to justify staying in a losing trade undermines the original analysis.
- Using identical timeframes for all currency pairs. Different pairs exhibit different volatility profiles; calibrate timeframe selection to each pair's typical daily range.
- Scalping during low-liquidity sessions. Trading 1-minute charts during Asian hours on EUR pairs typically results in wide spreads and unreliable signals.
- Analysis paralysis from excessive timeframes. Monitoring six or more timeframes creates conflicting information; three timeframes maximum per trade decision is generally sufficient.
- Ignoring higher timeframe trends. Taking short positions on 15-minute signals while the daily chart shows strong upward momentum creates unnecessary headwinds.
- Miscalibrated indicators across timeframes. A 200-period moving average represents vastly different data on a 1-minute chart (3 hours) versus a daily chart (nearly one year).
- Choosing timeframes based on others' preferences. Following a scalping approach when available time permits only evening chart reviews creates an unsustainable mismatch.
How to Choose the Right Forex Trading Timeframe for You - A Practical Decision Framework
Selecting your optimal timeframe depends on your available screen time, psychological temperament, and capital constraints. This framework guides you through the key factors that should shape your decision.
Step 1: Assess Your Available Time
Traders with 6+ hours daily for chart monitoring may consider scalping or day trading (1-minute to 1-hour). Those who can check charts 1–2 times daily align better with swing trading (4-hour to daily). Weekend or evening-only availability suggests position trading (daily to weekly).
Step 2: Assess Your Risk Tolerance and Capital
Smaller accounts with lower risk tolerance face challenges with scalping due to proportionally higher spread costs. A general guideline suggests stop-losses should not exceed 1–2% of account value per trade, regardless of timeframe.
Step 3: Assess Your Psychological Profile
Traders requiring constant feedback and action may gravitate toward shorter timeframes- though the associated stress warrants consideration. Those comfortable with uncertainty and waiting periods may find longer timeframes more rewarding. Anyone prone to emotional decisions under pressure typically benefits from starting longer and moving shorter only after demonstrating consistent discipline.
Step 4: Match to Your Strategy Type
Trend following approaches generally align with daily/weekly charts. Breakout strategies often work on 4-hour/daily timeframes. Mean reversion systems may function well on 1-hour/4-hour charts. News trading typically uses 15-minute/1-hour for post-announcement follow-through analysis.
Step 5: Test Before Committing
Back-testing with 50–100 historical setups helps establish baseline expectations. Forward-testing on demo accounts for 4–8 weeks validates real-time execution. Tracking win rate, average reward-to-risk, maximum drawdown, and emotional state during trading provides data for informed decisions.
Key Takeaways: Best Timeframes for Forex Trading
- No single "best" forex trading timeframe exists universally—optimal selection depends on individual strategy, lifestyle, capital, and psychological makeup
- Scalpers typically use 1–5 minute charts during high-liquidity sessions
- Day traders generally work best with 15-minute to 1-hour charts
- Swing traders favor 4-hour and daily charts
- Position traders utilize daily, weekly, and monthly charts
- Beginners often benefit from starting on 1-hour and 4-hour charts before exploring shorter or longer periods
- Multiple timeframe analysis (top-down approach) represents the standard: higher timeframes for direction, lower timeframes for entry precision
- Stop-loss sizing connects directly to timeframe selection—stops calibrated for one timeframe typically perform poorly when applied to different timeframes
- Matching timeframe selection to active liquidity sessions significantly affects trading outcomes
- Testing any new timeframe with substantial historical data before live implementation reduces unnecessary learning costs
Trading Multiple Timeframes with TIOmarkets
TIOmarkets provides access to both MetaTrader 4 and MetaTrader 5 platforms, giving you the tools needed for comprehensive timeframe analysis. MT5 stands out with 21 analytical timeframes, ranging from 1-minute to monthly charts, offering greater flexibility for multi-timeframe strategies compared to MT4's 9 timeframes. Whether you scalp, day trade, or hold positions long-term, these platforms deliver the charting capabilities to match your trading style.
If you want to consider starting with a demo account practice on your chosen timeframe, you can - while also exploring related concepts like multiple timeframe analysis to develop a comprehensive approach.

FAQ
Risk disclaimer: CFDs are complex instruments and come with a high risk of losing money rapidly due to leverage. You should consider whether you understand how CFDs work and whether you can afford to take the high risk of losing your money. Never deposit more than you are prepared to lose. Professional client’s losses can exceed their deposit. Please see our risk warning policy and seek independent professional advice if you do not fully understand. This information is not directed or intended for distribution to or use by residents of certain countries/jurisdictions including, but not limited to, USA & Countries included in the OFAC sanction list. The Company holds the right to alter the aforementioned list of countries at its own discretion.
TIOmarkets offers an exclusively execution-only service. The views expressed are for information purposes only. None of the content provided constitutes any form of investment advice. The comments are made available purely for educational and marketing purposes and do NOT constitute advice or investment recommendation (and should not be considered as such) and do not in any way constitute an invitation to acquire any financial instrument or product. TIOmarkets and its affiliates and consultants are not liable for any damages that may be caused by individual comments or statements by TIOmarkets analysis and assumes no liability with respect to the completeness and correctness of the content presented. The investor is solely responsible for the risk of his/her investment decisions. The analyses and comments presented do not include any consideration of your personal investment objectives, financial circumstances, or needs. The content has not been prepared in accordance with any legal requirements for financial analysis and must, therefore, be viewed by the reader as marketing information. TIOmarkets prohibits duplication or publication without explicit approval.
Join us on social media



Authors BIO

Maria is a writer and content strategist with over 10 years of experience in the finance industry. She specializes in developing research-backed articles that help financial professionals navigate complex market topics with confidence. Her expertise spans forex, stocks, CFDs and global markets, creating insightful content that educates readers and supports informed decision-making.





