


What Is a Hammer Candlestick Pattern & How to Trade It
BY Maria K.
|September 7, 2026The hammer candlestick pattern is a single-candle bullish reversal formation that appears at the bottom of downtrends. It resembles a hammer or lollipop, with a small body at the top and a long "handle" (shadow) extending below. This hammer reversal pattern signals that sellers attempted to push prices lower but buyers stepped in and pushed prices back up, suggesting the downtrend might be ending. Understanding this Japanese hammer candlestick formation can help traders identify potential trend reversals before they fully develop.
This comprehensive hammer technical analysis guide will analyse the pattern's anatomy, validation criteria, step-by-step trading process, common strategies, limitations, and common mistakes to help you incorporate this reversal signal into your trading approach.
What Is the Hammer Candlestick Pattern and Why Does It Matter?
The hammer candlestick pattern is a single-candle bullish reversal indicator that signals a potential shift from heavy selling pressure to buyer dominance after a market decline. It is basically a signal characterized by a small real body near the top of the trading range and a long lower shadow that extends at least twice the length of the body.
Think of it like an actual hammer tool: small head at the top, long handle extending downward. The basic message this candlestick hammer signal sends is straightforward: "Buyers are fighting back against sellers."
Why Should Beginners Know This Pattern?
The hammer formation trading setup ranks among the most accessible patterns for new traders for several reasons:
- Easy to spot: The distinctive shape makes visual identification relatively simple compared to more complex multi-candle patterns
- Frequent appearances: Hammers form across all markets: stocks, forex, cryptocurrencies, and commodities
- Clear framework: The pattern provides defined parameters for entry points, stop-loss placement, and profit targets
If you are new to trading and want to learn more about forex and how it works, TIOmarkets offers this free course spread over 15 comprehensive video lessons. Lesson 6 specifically covers candlestick charts, helping new traders recognize patterns like the hammer.
Why Is a Hammer Candlestick Pattern Important for Traders?
Hammer patterns are important because they may help traders identify potential trend reversals early, before a new uptrend fully develops. They appear at market bottoms where fear tends to be highest, potentially offering opportunities to enter at discounted prices if the reversal confirms.
Early Reversal Detection
Hammers can signal the potential end of a downtrend before it becomes obvious to the broader market. This timing aspect may allow traders to position themselves near bottoms rather than chasing prices higher after moves have already occurred.
Clear Risk-Reward Framework
The hammer pattern confirmation process provides a natural stop-loss level—below the hammer's low. This means traders can define exactly where their trade thesis becomes invalid before entering any position.
Universal Application
The bullish hammer candle appears across:
- Equities and indices
- Currency pairs
- Cryptocurrencies
- Commodities and futures
- Various timeframes (though some demonstrate more reliability than others)
Psychological Insight
Understanding candlestick patterns is essential for anyone looking to delve into the world of online trading. These patterns serve as a visual representation of market sentiment, offering insights into potential price movements.
In our case, hammers reveal what buyers and sellers are actually doing: a single candle encapsulates the shift in market sentiment; from seller dominance to buyer resurgence.
Anatomy of a Hammer Candlestick Pattern
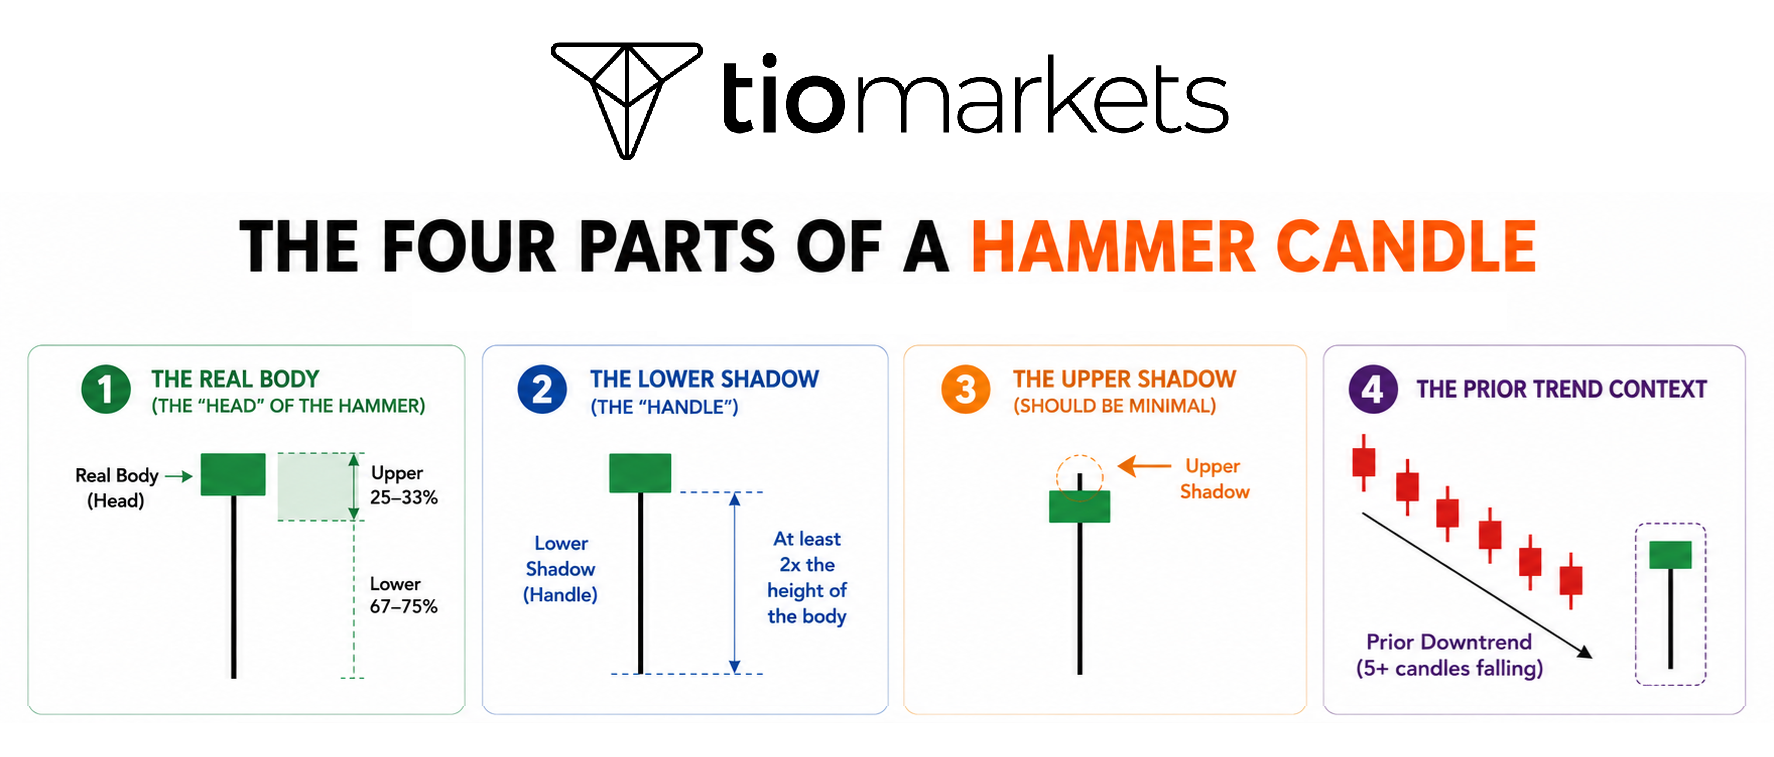
A hammer candlestick has four essential components: (1) a small real body at the top showing where prices opened and closed, (2) a long lower shadow (at least twice as long as the body) showing how far sellers pushed prices down, (3) little to no upper shadow above the body, and (4) it must appear after prices have been declining.
The Four Parts of a Hammer Candle (With Visual Guide)
Part 1: The Real Body (The "Head" of the Hammer)
The real body is the thick rectangular portion showing opening and closing prices. For a valid hammer:
- Position: Near the top of the candle (upper 25-33% of total range)
- Size: Relatively small compared to the lower shadow
- Visual reference: Think of it as the "head" of a hammer tool
Part 2: The Lower Shadow (The "Handle")
The lower shadow is the thin line extending below the body:
- Key measurement: Should be at least 2x the height of the body
- Interpretation: Represents how far sellers pushed prices down before buyers took control
- Principle: Longer shadows generally indicate stronger rejection of lower prices
Part 3: The Upper Shadow (Should Be Minimal)
The upper shadow is any thin line extending above the body:
- Guideline: Should be very small or non-existent (typically less than 10% of body size)
- Significance: Large upper shadows may weaken the bullish signal
Part 4: The Prior Trend Context
The preceding price movement before the hammer formed:
- Requirement: Must appear after a downtrend (prices falling for at least 5+ candles)
- Critical distinction: A hammer-shaped candle appearing in an uptrend is NOT a hammer, it's classified as a different pattern
Body Color: Does Green vs. Red Matter?
When examining hammer candlesticks, traders often wonder whether the color of the body affects the signal's validity. A green (bullish) body indicates that the price closed higher than it opened, and this is generally considered a slightly stronger signal since it shows buyers pushed prices up from the open by the close. A red (bearish) body means the price closed lower than it opened, which is still valid as a hammer pattern but may be considered potentially slightly weaker since sellers maintained some control at the close. However, the key point remains that both colors can form valid hammers. The shape and location of the candlestick typically matter more than the color, as the long lower shadow and positioning after a downtrend are the defining characteristics that give the pattern its meaning.
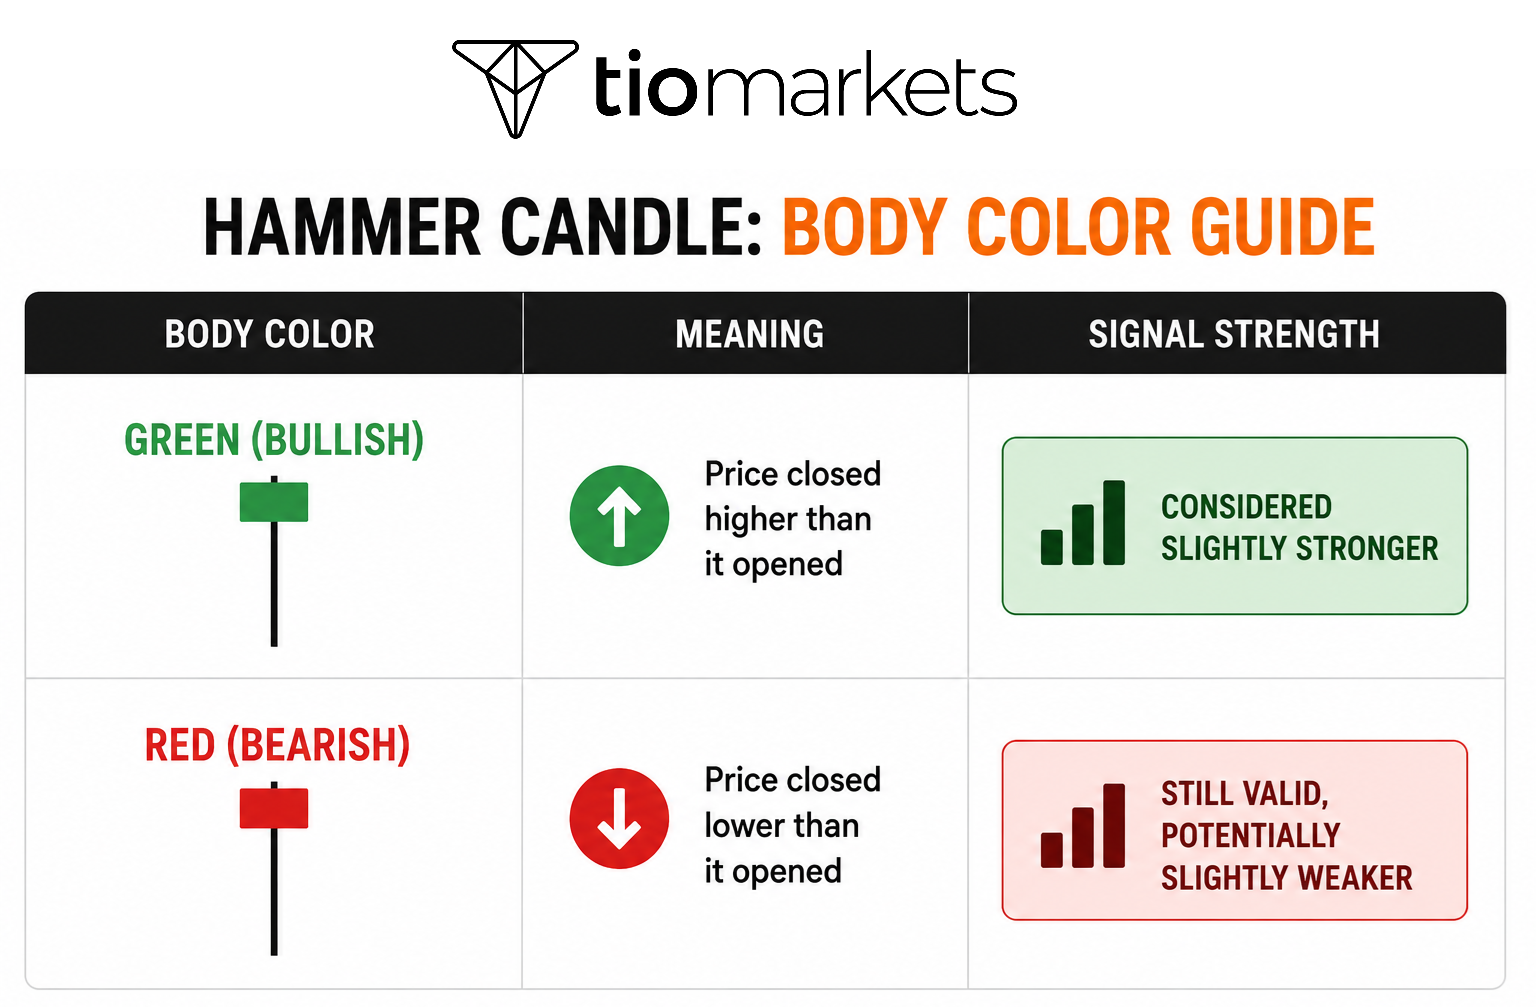
Key point: Both colors can form valid hammers. The shape and location typically matter more than the color.
How to Read Hammer Candlestick Pattern
Reading a hammer candlestick means understanding the battle between buyers and sellers that it represents. During the candle's formation, sellers initially dominated (creating the long lower shadow), but by the close, buyers had pushed prices back up near the open, potentially signaling that selling pressure may be exhausted.
The Story a Hammer Tells (Step-by-Step)
That is how a hammer candle works and forms in real time.
Stage 1: The Candle Opens | The candle opens at a certain level while the downtrend has been ongoing and sellers appear in control.
Stage 2: Sellers Attack (Creating the Long Lower Shadow) | Sellers attack and push prices significantly lower, creating the long lower shadow as it appears the downtrend will continue and fear typically reaches elevated levels.
Stage 3: Buyers Step In (The Reversal) | Buyers step in at the low point and begin buying aggressively, causing prices to start climbing back up while sellers begin losing their grip.
Stage 4: The Candle Closes (Near the High) | The candle closes near the high as prices have recovered most of the losses by the end of the period, with the long lower shadow showing the failed attempt to push prices lower and implying that sellers tried and failed.
Why the Long Lower Shadow Is So Important
The lower shadow represents rejected prices: levels where the market essentially said "prices shouldn't be this low." Consider this analogy: pushing a beach ball underwater (selling pressure) only to have it shoot back up (buying pressure). That bounce demonstrates underlying strength. Longer lower shadows typically indicate more forceful rejection of lower prices.
How to Identify a Valid Hammer Candlestick Pattern?
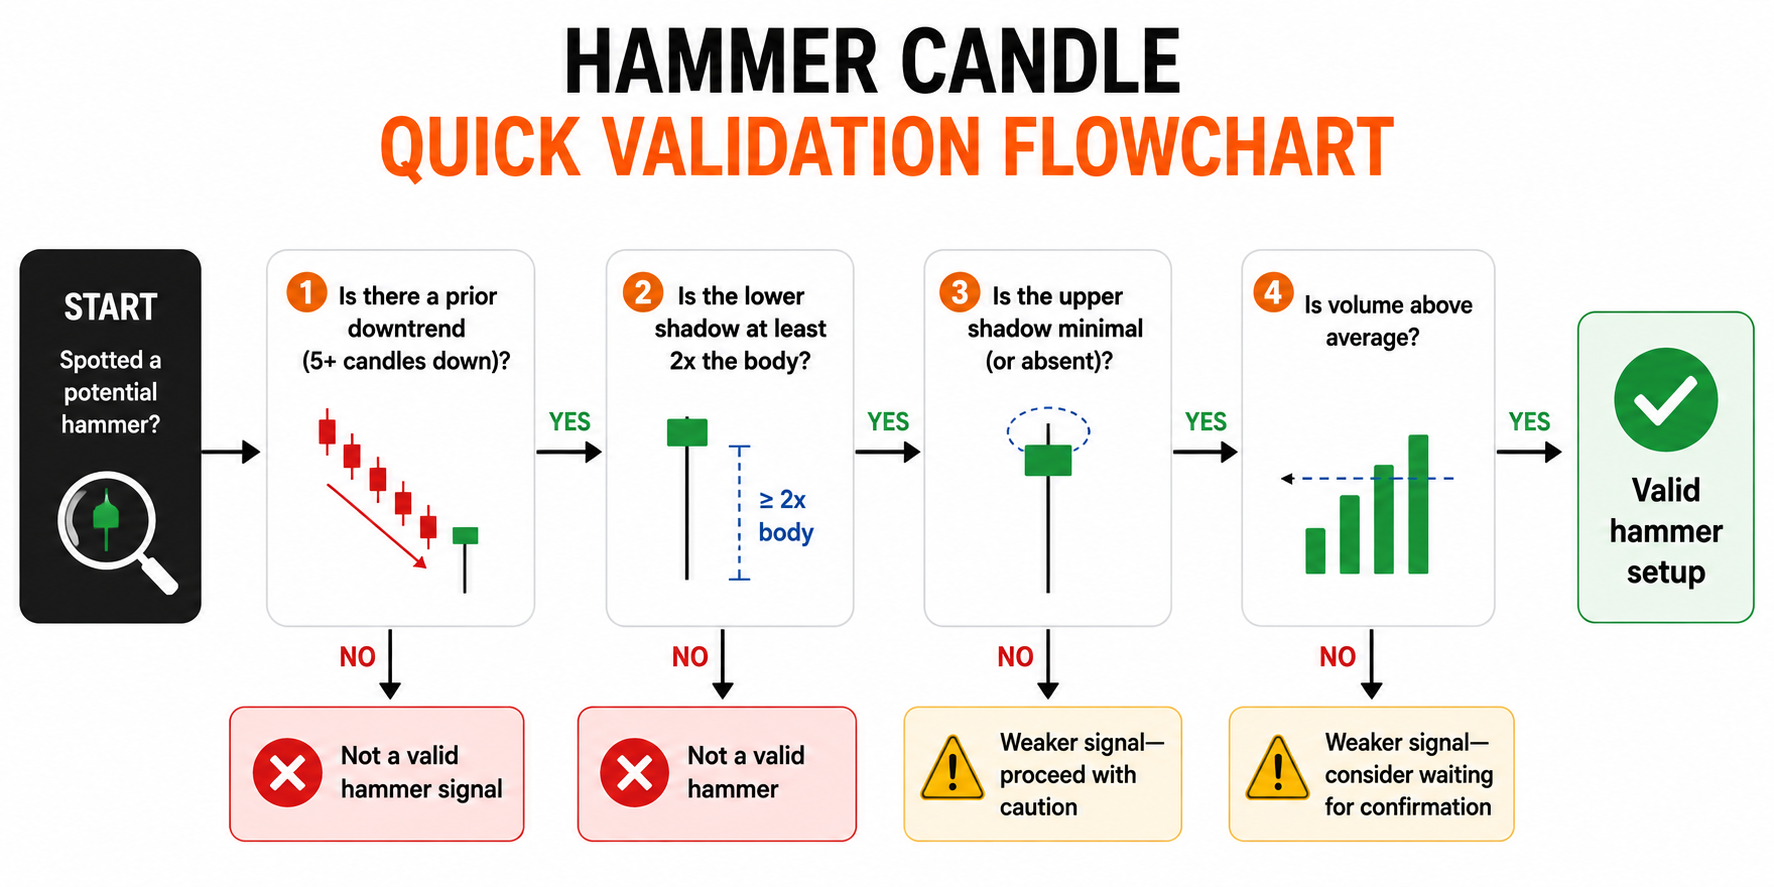
Not every candle that looks like a hammer constitutes a valid trading signal. To filter out potential false signals, traders typically check five elements: (1) a prior downtrend exists, (2) the lower shadow is at least 2x the body, (3) the upper shadow is tiny or absent, (4) the body sits in the upper portion of the range, and (5) volume supports the pattern.
The 5-Point Hammer Validation Checklist
Checkpoint 1: Is There a Prior Downtrend?
The way traders do it is look for prices declining for at least 5-8 candles with a meaningful drop from recent highs. Without a downtrend, there's nothing to reverse. One common error is trading hammers that appear in sideways markets where the pattern loses its significance.
Checkpoint 2: Is the Lower Shadow Long Enough?
The lower shadow should be at least twice the body height (2:1 rule), with ratios of 2.5x to 3x potentially indicating stronger rejection. To measure, calculate the body height as the difference between close and open, then divide the lower shadow length by the body height.
Checkpoint 3: Is the Upper Shadow Minimal?
The upper shadow should be less than 10% of the body size, with no upper shadow being ideal. Large upper shadows may indicate selling pressure at the close, weakening the signal.
Checkpoint 4: Is the Body Positioned Correctly?
The body should sit in the upper 25-33% of the total candle range, showing that buyers successfully pushed the close near the high.
Checkpoint 5: Does Volume Support the Pattern?
The indication is volume higher than the 10-candle average, with 50% or more above average being a stronger signal. Higher volume indicates more conviction behind the potential reversal.
Hammer Candlestick Pattern: Quick Validation Flowchart
What Are the Different Types of a Hammer Candlestick Pattern?
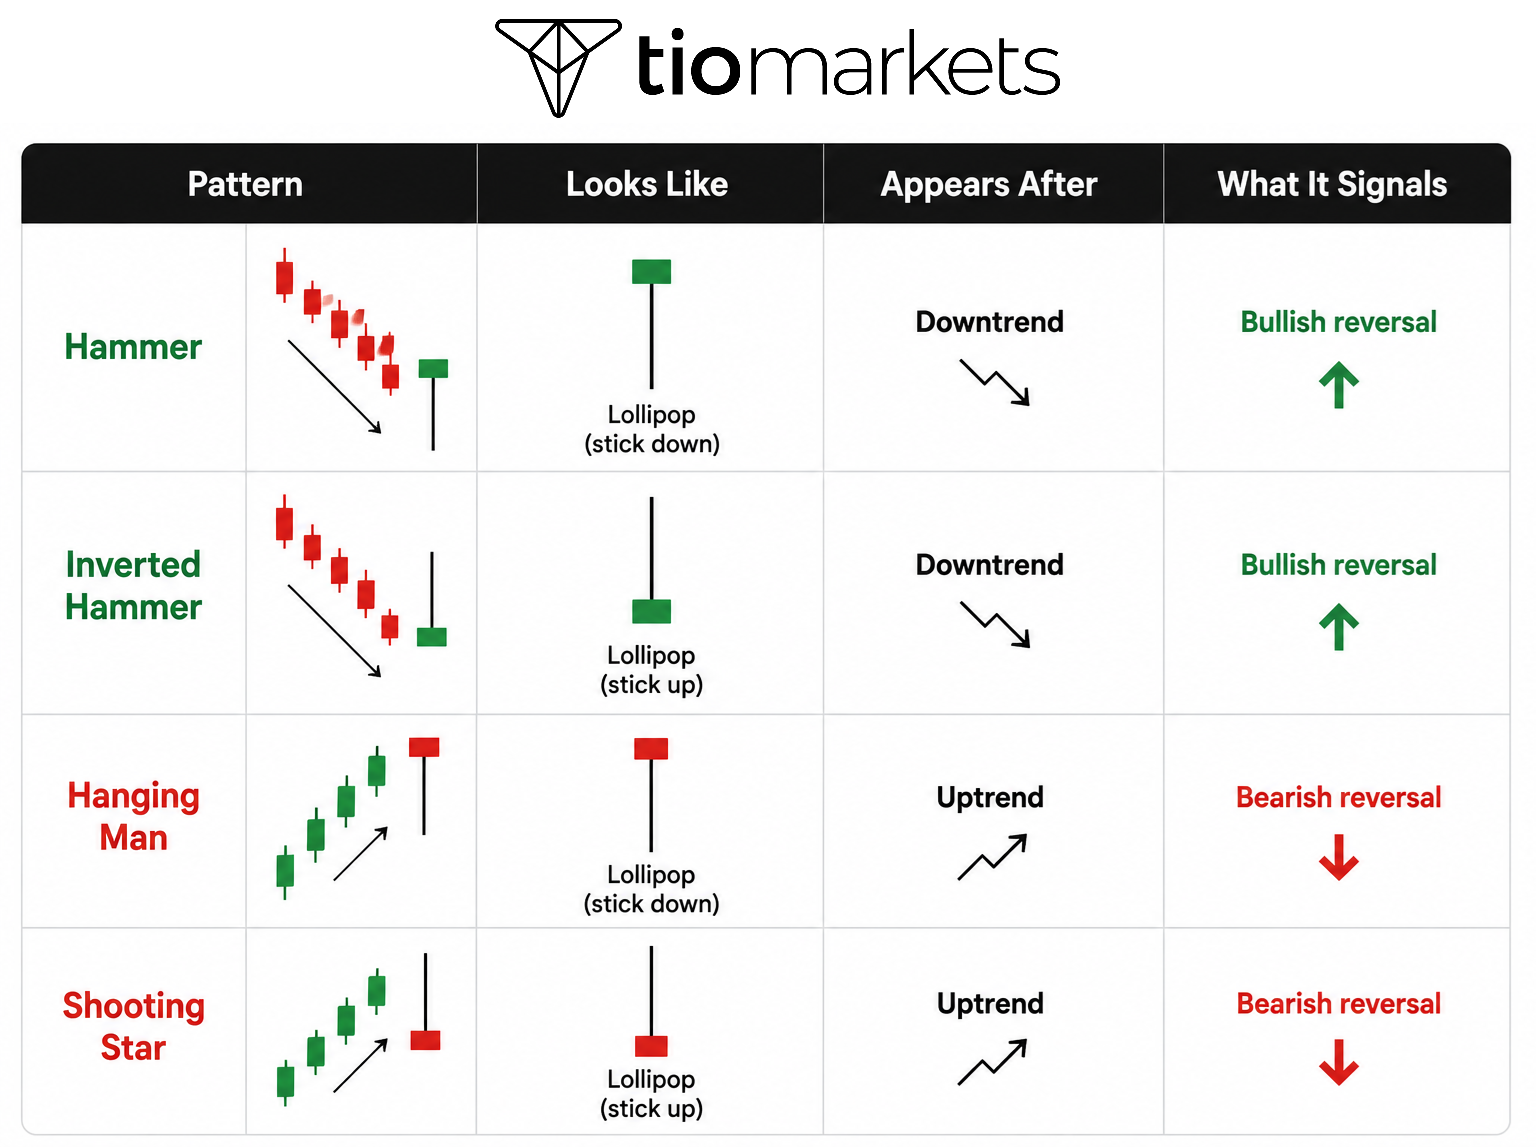
There are two main types of hammer patterns: the standard hammer (bullish reversal with a long lower shadow) and the inverted hammer (also bullish but with a long upper shadow instead). Additionally, traders should know to distinguish hammers from similar-looking patterns like the hanging man and shooting star that signal opposite directions.
The Standard Hammer
- Appearance: Small body at top, long lower shadow, little/no upper shadow
- Location: Bottom of a downtrend
- Signal: Bullish reversal (potential buying opportunity)
- Psychology: Sellers pushed hard but buyers rejected lower prices
The Inverted Hammer
- Appearance: Small body at bottom, long upper shadow, little/no lower shadow
- Location: Bottom of a downtrend (same as standard hammer)
- Signal: Bullish reversal (potential buying opportunity)
- Psychology: Buyers tried to push prices up but met resistance—still indicates buying interest emerging
- Key difference from standard hammer: The long shadow points UP, not down
Hammer Candlestick Pattern vs. Look-Alike Patterns: Critical Distinctions
The critical difference is the context so traders need to be alert. The hammer and hanging man pattern look identical. The shooting star and inverted hammer vs hammer appear the same visually. The differentiating factor is location:
- Same shape after DOWNTREND = Bullish (hammer/inverted hammer)
- Same shape after UPTREND = Bearish (hanging man/shooting star)
How to Trade the Hammer Candlestick Pattern
A typical hammer trading approach involves: (1) identifying a valid hammer after a downtrend, (2) waiting for confirmation (next candle closing above the hammer's high), (3) entering the trade, (4) placing a stop-loss below the hammer's low, and (5) setting a profit target.
Step 1: Identifying and Validating the Pattern
The 5-point checklist from earlier provides the validation framework.
Step 2: Waiting for Confirmation (Often Considered Critical)
Many traders wait for the next candle to close above the hammer's high before entering. Confirmation criteria typically include:
- The next candle closes ABOVE the hammer's high
- The confirmation candle is also bullish (green)
- Volume remains supportive
Step 3: Entering the Trade
Conservative traders typically enter after a confirmation candle closes above the hammer's high, while aggressive traders may enter on an intraday break above the hammer's high.
Step 4: Placing Stop-Loss
Standard stop-loss placement typically involves:
- Placing it slightly below the hammer's low (the bottom of the shadow)
- This represents the level where the trade thesis becomes invalid
- Small buffers (a few points below the exact low) may help avoid stops triggered by normal price noise
Step 5: Setting Profit Target
Many traders use a risk-reward ratio of at least 2:1 (targeting 100 points if risking 50), or aim for 3x when conditions allow. Alternatively, they target nearby technical resistance levels like previous highs or moving averages, keeping in mind that a single hammer typically won't reverse an entire bear market.
Hammer Candlestick Pattern Trading Strategies
Three commonly referenced hammer trading strategies include: (1) the Support Level Hammer strategy (trading hammers at key support zones), (2) the Moving Average Hammer strategy (trading hammers near the 50 or 200-day moving average), and (3) the RSI Oversold Hammer strategy (trading hammers when RSI shows oversold conditions below 30).
Strategy 1: The Support Level Hammer
Some traders use hammers that form at confirmed support levels where price has bounced 2-3 times previously. When price declines to support and forms a hammer, they enter after a confirmation candle closes above the hammer's high. Traders place the stop-loss below both the hammer low and support level, targeting the next resistance or a 2:1 risk-reward. This approach combines two potentially reinforcing signals: historical buyer interest at support plus the hammer's bullish indication.
Strategy 2: The Moving Average Hammer
Many others trade hammers forming near key moving averages like the 50-day or 200-day. When price declines to touch or approach these levels and forms a hammer, they enter after confirmation. Setting stop-loss below both the hammer low and the moving average, they target 2:1 risk-reward or the next resistance. This strategy usually works for assets that historically respect moving averages as dynamic support.
Strategy 3: The RSI Oversold Hammer
It is also common to combine hammers with RSI (14-period) oversold readings below 30. When RSI enters oversold territory and a hammer forms, they enter after confirmation; ideally as RSI begins curving upward - applying standard stop-loss and target parameters. This strategy pairs two potential reversal signals: an oversold RSI suggesting exhausted selling pressure plus the hammer's bullish indication.
What Are the Limitations of Using Hammer Candlesticks?
Hammer candlestick patterns have limitations including: subjective interpretation of what qualifies as "valid," reduced effectiveness in choppy/sideways markets, lagging nature (visible only after completion), and the need for additional confirmation which may reduce profit potential.
Limitation 1: Subjectivity in Pattern Identification
Questions like "What counts as a long enough shadow?" and "How many candles constitute a prior downtrend?" don't have universally agreed-upon answers. Different traders may identify different candles as valid hammers. Using consistent, predefined rules (like the checklist) can help reduce subjectivity.
Limitation 2: Reduced Effectiveness in Ranging Markets
Hammers are reversal patterns: they require a trend to reverse. In choppy, sideways markets, hammers may generate numerous false signals. Many traders only consider hammers when there's a clear prior downtrend.
Limitation 3: Lagging Indicator
Hammers can only be identified after the candle closes. By then, some price movement may have already occurred. Waiting for confirmation means additional movement may be missed. This delay may actually increase reliability by filtering premature signals.
Limitation 4: No Pattern Works in Isolation
Hammers typically shouldn't serve as the sole reason for entering trades. Combining with support/resistance analysis, volume study, and trend evaluation may improve outcomes. The hammer represents one piece of evidence, not the complete picture.
Mistakes to Avoid with Hammer Candlestick Patterns
Common beginner mistakes include the below or more.
- Trading Without Confirmation: Seeing a hammer form and immediately entering. Many hammers don't lead to reversals; confirmation helps filter false signals
- Trading Hammers in Sideways Markets: Seeing a hammer-shaped candle in a range-bound market. Without a trend to reverse, the pattern loses its meaning.
- Stop-Loss Too Tight: Placing stop-loss right at the hammer's low with no buffer. Normal price fluctuations may trigger premature exits.
- Ignoring Volume: Trading every hammer regardless of volume. Low-volume hammers may lack conviction behind the potential reversal.
- Over-Leveraging / Excessive Risk: Risking 5-10% or more of account on a single hammer trade. Even valid patterns fail; excessive risk can lead to significant drawdowns.
Before entering hammer trades, confirming these elements may help.
- Stop-loss level defined
- Profit target identified
- Risk limited to acceptable percentage of account
- Confirmation received
- Prepared for the possibility of loss
Final Thoughts on the Hammer Candlestick Pattern
The hammer candlestick pattern is one of the most recognizable and beginner-accessible reversal patterns in technical analysis. Effective application typically requires many checks listed in this article.
Key Takeaways for Traders
- Proper identification: Not every hammer-shaped candle is tradeable
- Patience matters: Waiting for confirmation may filter many false signals
- Context matters: Hammers require a prior downtrend and ideally support confluence
- Volume adds information: Higher-volume hammers may be more reliable
- No pattern is perfect: Accepting losses as part of trading helps maintain perspective

FAQ
Risk disclaimer: CFDs are complex instruments and come with a high risk of losing money rapidly due to leverage. You should consider whether you understand how CFDs work and whether you can afford to take the high risk of losing your money. Never deposit more than you are prepared to lose. Professional client’s losses can exceed their deposit. Please see our risk warning policy and seek independent professional advice if you do not fully understand. This information is not directed or intended for distribution to or use by residents of certain countries/jurisdictions including, but not limited to, USA & Countries included in the OFAC sanction list. The Company holds the right to alter the aforementioned list of countries at its own discretion.
TIOmarkets offers an exclusively execution-only service. The views expressed are for information purposes only. None of the content provided constitutes any form of investment advice. The comments are made available purely for educational and marketing purposes and do NOT constitute advice or investment recommendation (and should not be considered as such) and do not in any way constitute an invitation to acquire any financial instrument or product. TIOmarkets and its affiliates and consultants are not liable for any damages that may be caused by individual comments or statements by TIOmarkets analysis and assumes no liability with respect to the completeness and correctness of the content presented. The investor is solely responsible for the risk of his/her investment decisions. The analyses and comments presented do not include any consideration of your personal investment objectives, financial circumstances, or needs. The content has not been prepared in accordance with any legal requirements for financial analysis and must, therefore, be viewed by the reader as marketing information. TIOmarkets prohibits duplication or publication without explicit approval.
Join us on social media



Authors BIO

Maria is a writer and content strategist with over 10 years of experience in the finance industry. She specializes in developing research-backed articles that help financial professionals navigate complex market topics with confidence. Her expertise spans forex, stocks, CFDs and global markets, creating insightful content that educates readers and supports informed decision-making.








