


Morning Star Candlestick Pattern Explained
BY Maria K.
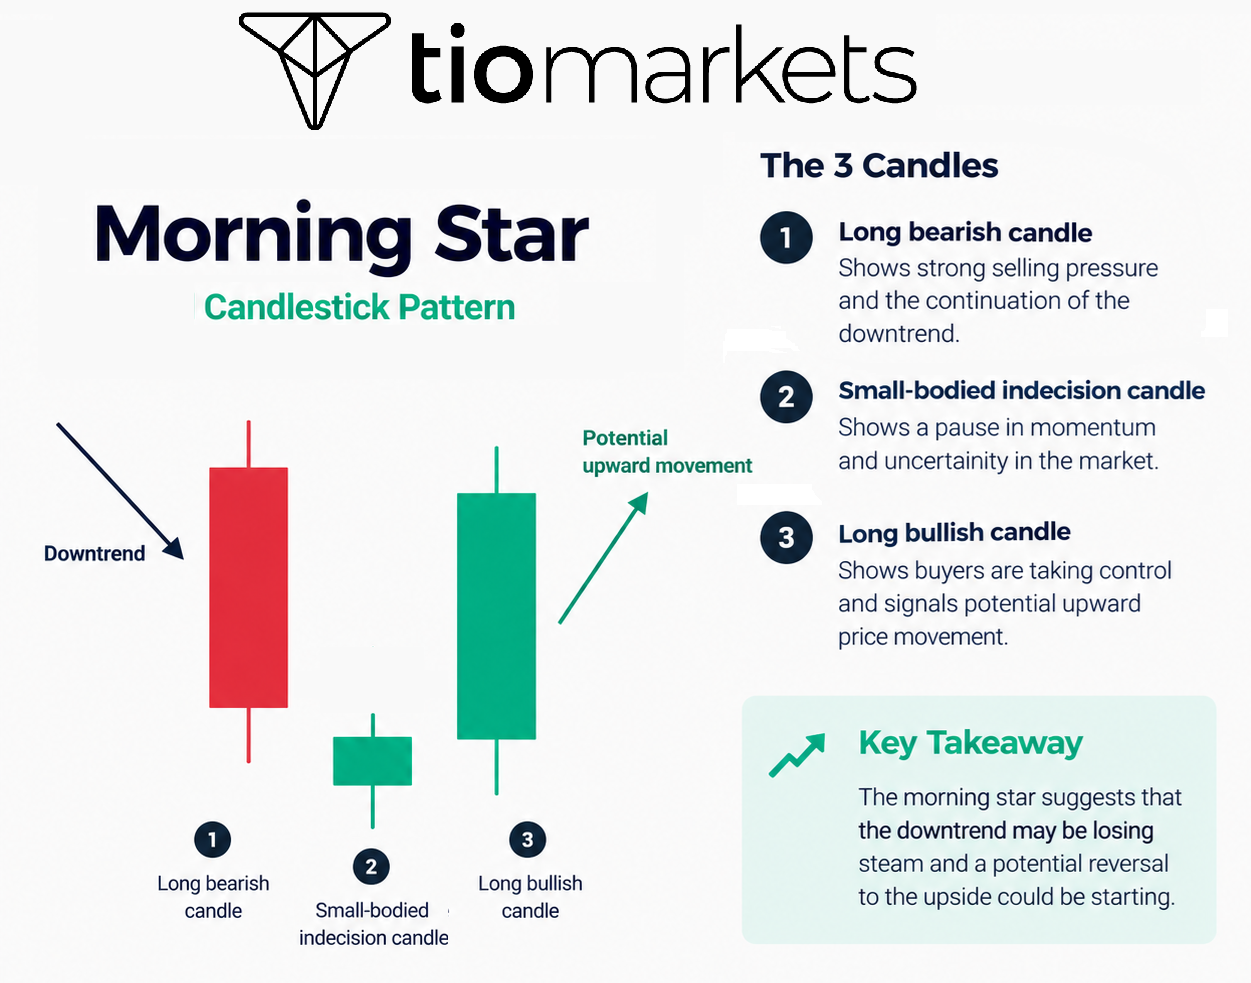
|September 8, 2026The morning star candlestick is a three-candle bullish reversal pattern that appears at the end of downtrends. It consists of a long bearish candle, a small-bodied indecision candle, and a long bullish candle that signals potential upward price movement.
The morning star candlestick represents one of the most recognized formations in technical chart analysis. This three-candle pattern falls under the classification of bullish reversal patterns, indicating a potential shift from downward to upward price momentum. Technical analysts observe this formation across multiple markets, including forex, equities, commodities, and cryptocurrency exchanges. The pattern serves as a visual representation of changing market sentiment, marking points where selling pressure may be diminishing while buying interest emerges.
This article covers the structure, identification methods, trading applications, limitations, and confirmation techniques associated with this candlestick chart pattern.
What Is a Morning Star Candlestick Pattern?
A morning star pattern is a three-period formation that indicates a potential shift from bearish to bullish market sentiment, typically forming after a sustained downtrend.
Morning Star Candlestick Definition and Classification
The technical definition describes this formation as a three-candle bullish reversal pattern appearing at the bottom of downtrends. Within the candlestick pattern taxonomy, it belongs to the category of multi-candle reversal formations, distinguishing it from single-candle patterns like hammers or dojis.
The pattern traces its origins to Japanese candlestick charting techniques developed by rice traders in the 18th century. The name derives from the planet Venus, which appears in the sky before sunrise, metaphorically representing the "dawn" of a new upward trend. As a reversal pattern rather than a continuation pattern, it signals potential trend direction changes rather than pauses within existing trends.
The Three Components of the Formation
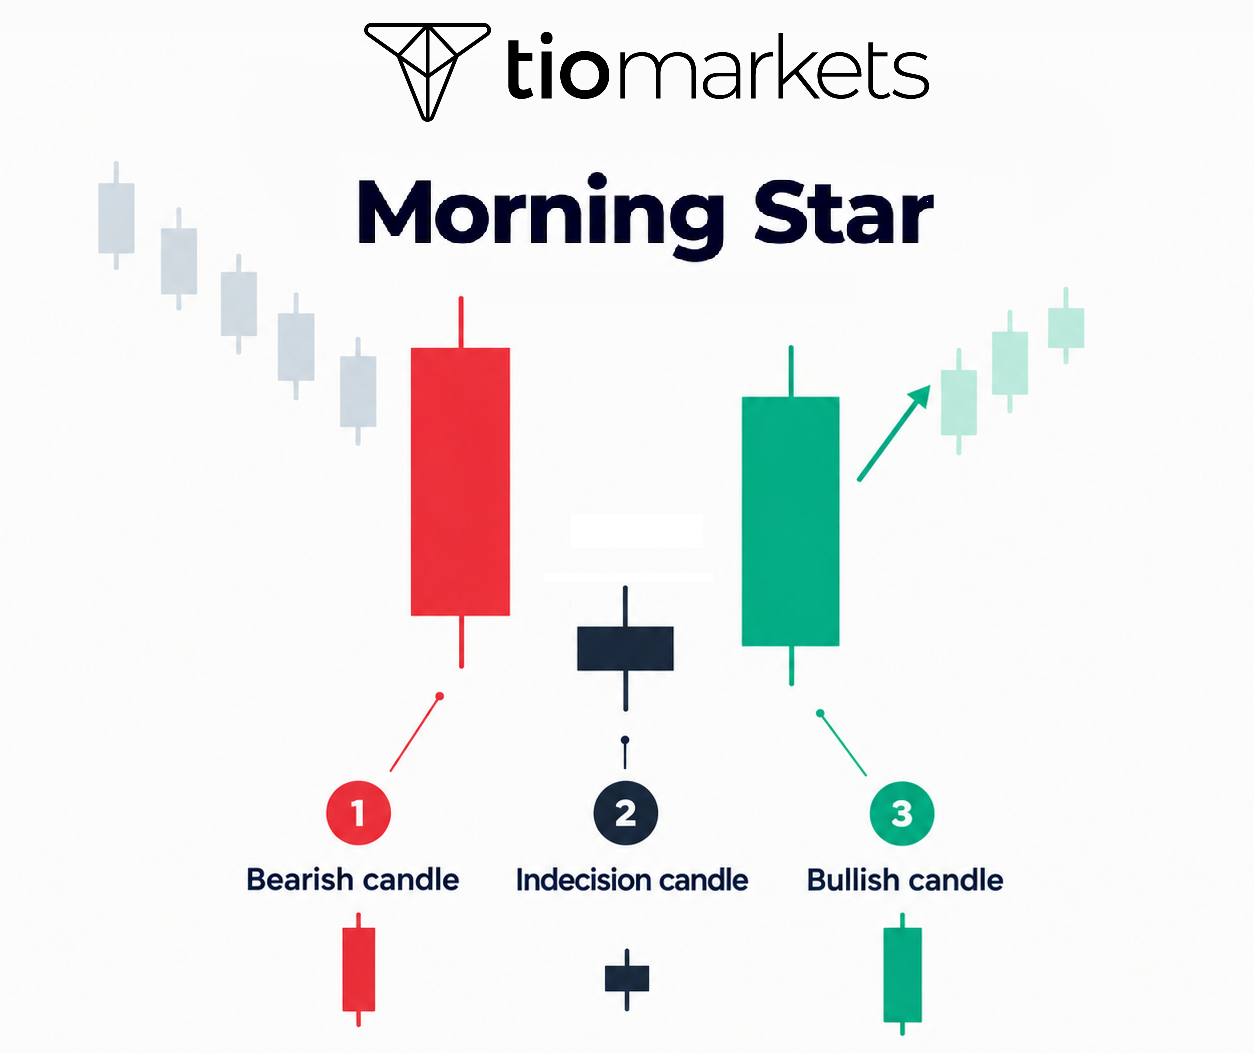
The first candle displays long bearish characteristics with a substantial red or black body, representing continued selling pressure during the downtrend. This candle confirms that sellers maintain control of price action.
The second candle presents a small-bodied indecision candle, which may appear as either bullish or bearish. The defining characteristic is the reduced body size compared to the surrounding candles, indicating uncertainty between buyers and sellers. This candle often gaps below the first candle's close in traditional formations.
The third candle shows long bullish confirmation features with a substantial green or white body. This candle typically closes above the midpoint of the first candle's body, demonstrating that buyers have gained significant control. A gap up from the second candle strengthens the formation when present.
How to Identify a Morning Star Candlestick on Charts?
Traders identify this pattern by locating three consecutive candles after a downtrend: a long red/bearish candle, a small-bodied candle (any color), and a long green/bullish candle that closes above the first candle's midpoint.
Visual Characteristics to Look For
The size relationship between the three candles provides primary identification criteria. The first and third candles should display notably larger bodies than the middle candle. Generally, the middle candle's body measures less than one-third of either surrounding candle.
Body-to-wick ratios vary across the formation. The first candle often shows a larger body relative to its wicks, indicating decisive selling. The middle candle may display proportionally longer wicks relative to its small body, suggesting indecision. The third candle typically shows a dominant body with relatively small wicks, indicating decisive buying.
The color sequence follows a bearish-neutral-bullish progression, though the middle candle's color holds less significance than its size. The position relative to preceding price action matters considerably: the pattern should appear after a clear downward price movement.
Gap Requirements and Variations
Traditional Japanese candlestick charting specifies gaps between candles as ideal characteristics. A gap-down after the first candle places the second candle's opening below the first candle's close. A gap-up before the third candle positions its opening above the second candle's close.
Modern markets, particularly forex markets that trade continuously, produce fewer gaps. Pattern validity in contemporary analysis does not require gaps, though their presence may enhance the formation's significance. Gaps indicate overnight or session breaks where sentiment shifted notably.
Where Morning Star Candlestick Patterns Typically Appear
This bullish reversal pattern forms at the bottom of established downtrends rather than during sideways price action. The preceding decline should be identifiable and sustained rather than minor or brief.
Proximity to support levels, whether horizontal support, trendlines, or moving averages, adds context to the formation. Patterns forming at recognized support zones may carry additional significance.
Timeframe considerations affect interpretation. Daily and weekly charts typically produce more reliable formations than intraday charts, though patterns appear across all timeframes used for candlestick charting.
What Does the Morning Star Candlestick Pattern Mean?
This pattern indicates that selling pressure is weakening and buying interest is emerging, suggesting a potential transition from bearish to bullish market control.
Market Psychology Behind the Formation
The first candle reflects seller dominance, with prices declining throughout the period as bearish sentiment controls activity. This confirms the existing downtrend remains intact.
The second candle represents market indecision. Neither buyers nor sellers establish clear control, resulting in the small-bodied candle. This indecision suggests the downtrend's momentum may be fading as sellers lose conviction or buyers begin testing the market.
The third candle demonstrates buyer emergence, with prices rising decisively throughout the period. The close above the first candle's midpoint indicates buyers have absorbed selling pressure and established directional control.
From a supply and demand perspective, the sequence shows supply (selling) exhausting while demand (buying) increases, a fundamental shift in the market's balance.
Signal Strength and Reliability Factors
Volume considerations significantly affect interpretation. Increasing volume on the third candle suggests stronger buying conviction, while declining volume may indicate weaker commitment to the reversal.
Pattern location relative to support zones influences reliability. Formations appearing at established support levels benefit from confluence with other technical factors.
The characteristics of the preceding downtrend matter. Patterns following extended, steep declines may carry different implications than those following shallow pullbacks. Confirmation from subsequent price action (continued upward movement after the pattern completes) usually validates the initial signal.
Morning Star Candlestick vs Doji Star Variation
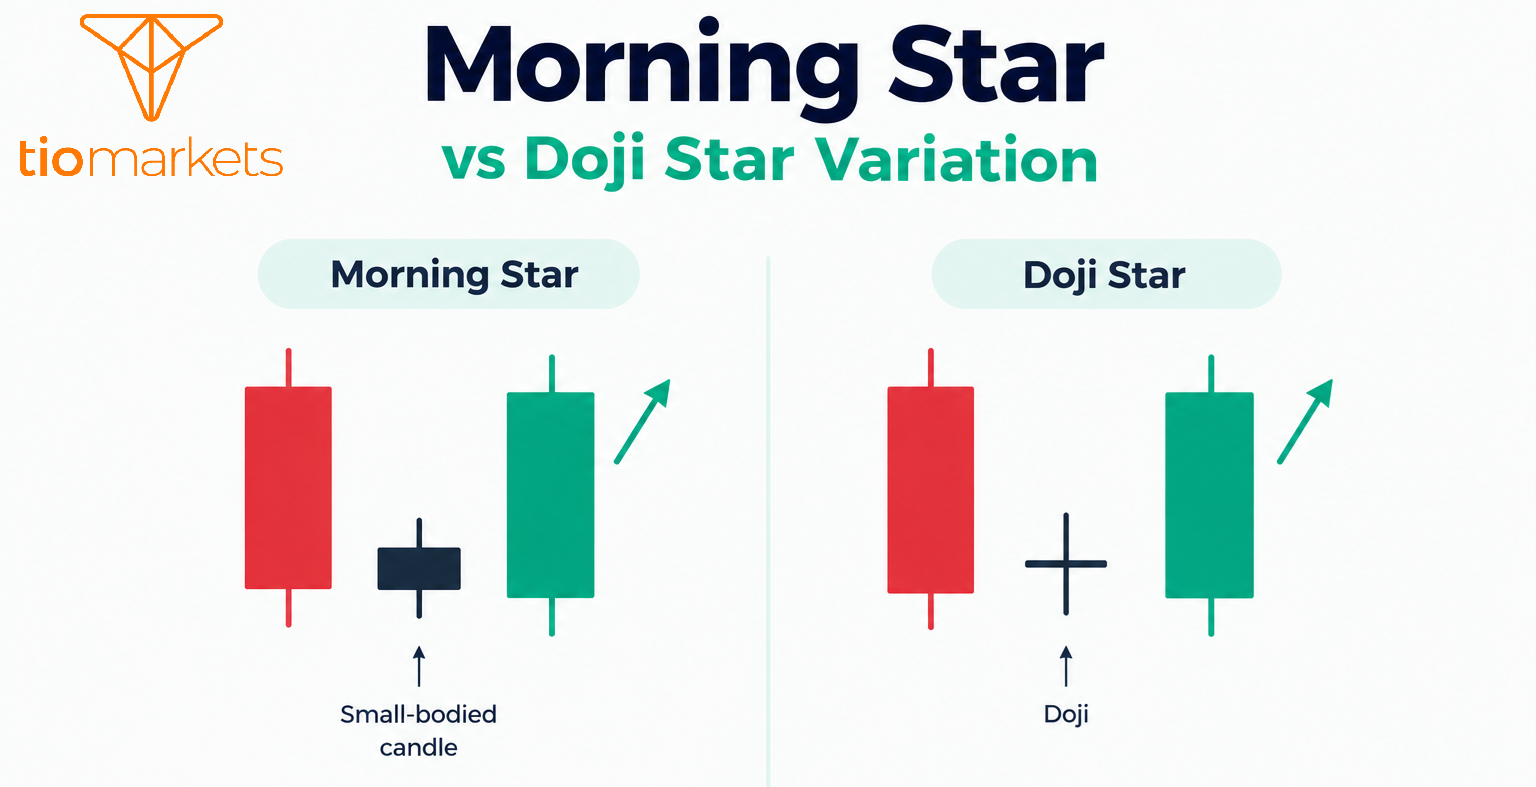
The doji star variation features a doji (open and close at nearly the same price) as the middle candle, which typically indicates stronger market indecision than a standard small-bodied candle.
Standard Pattern Characteristics
The standard version displays a small-bodied second candle with a visible body, meaning the open and close prices differ enough to create observable vertical distance. The middle candle may be either bullish or bearish in color. This version indicates general indecision without complete equilibrium between buyers and sellers.
Doji Star Specifications
The doji star variation requires a doji formation in the middle position. A doji occurs when opening and closing prices are nearly identical, creating a cross or plus-sign shape with minimal or no visible body.
This doji formation indicates enhanced indecision—complete equilibrium between buying and selling pressure during that period. Technical analysts often interpret this variation as a potentially stronger reversal signal, as the balance between forces appears more precise.
Visual identification differs primarily in the middle candle's appearance. The doji shows a horizontal line where the body would appear, while the standard version displays a small but visible rectangular body.
Morning Star Candlestick vs Evening Star Pattern
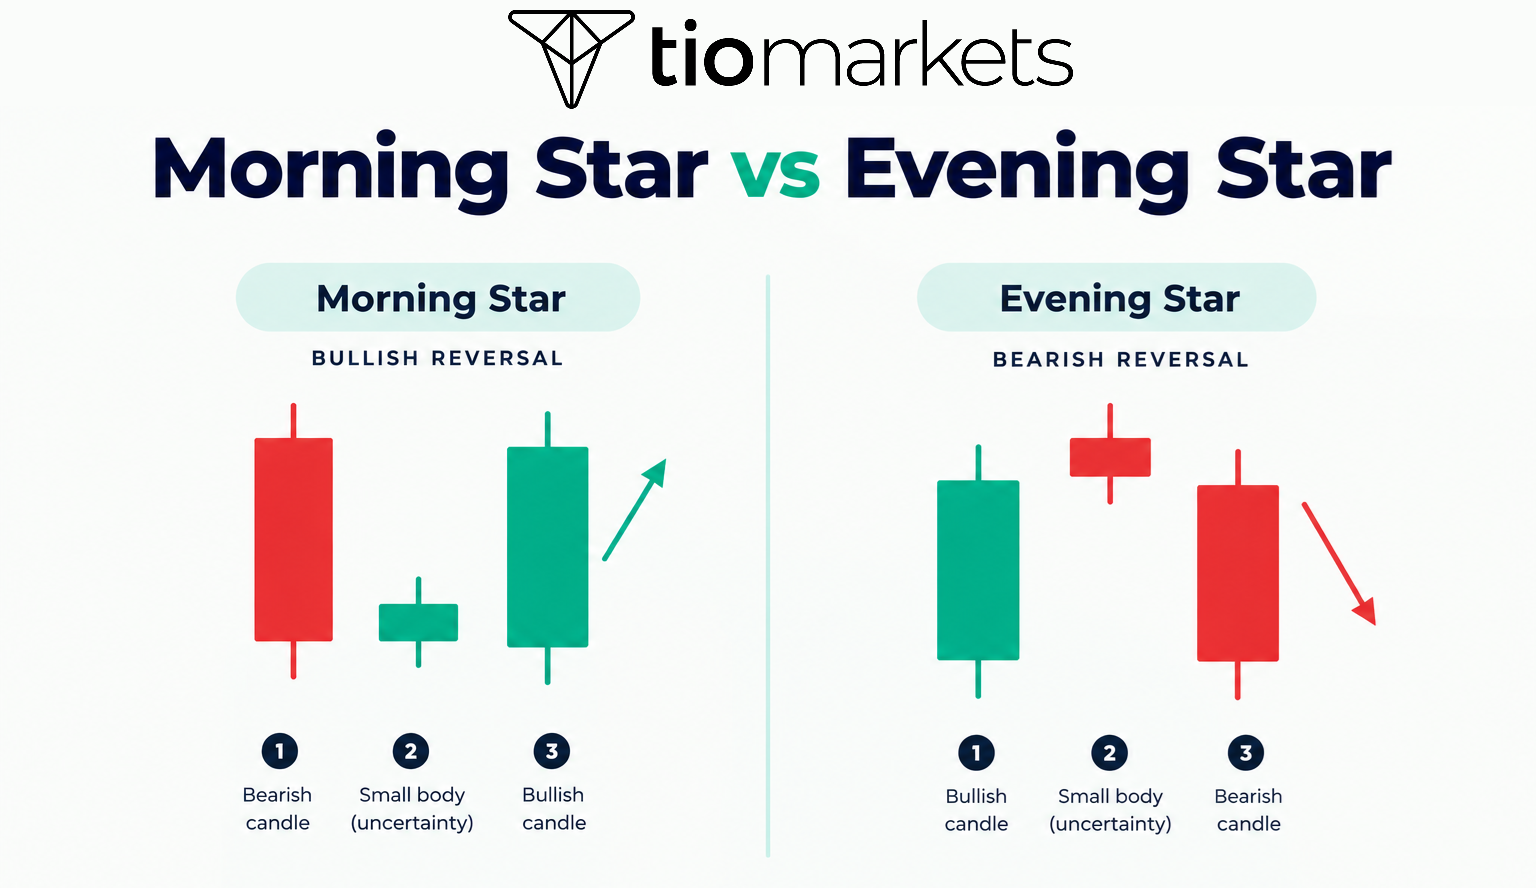
The evening star pattern is the bearish counterpart, appearing at the top of uptrends and signaling potential downward reversals with three candles in opposite formation.
Evening Star Pattern Structure
The evening star forms as a three-candle bearish formation with reversed characteristics. It begins with a long bullish candle, followed by a small-bodied indecision candle, and concludes with a long bearish candle. This pattern appears at uptrend peaks rather than downtrend bottoms.
The evening star serves as a mirror image of the bullish version, indicating potential downward price movement rather than upward. Both patterns share the three-candle structure and indecision concept but apply to opposite market contexts.
Key Differences Between Evening Star and Morning Star Formation
Trend context differs fundamentally. The bullish version appears after downtrends, while the evening star appears after uptrends. This contextual difference determines which pattern traders seek based on market conditions.
Directional implications oppose each other. The bullish formation suggests potential upward movement, while the bearish version suggests potential downward movement.
Trading application differences follow logically. Traders might consider long positions following the bullish pattern and short positions or exit strategies following the evening star. Recognition requires understanding the current market phase to identify which pattern may be forming.
How to Trade with Morning Star Candlestick Pattern
Traders use this formation to identify potential entry points for long positions, typically waiting for the third candle to close and confirm the formation before executing trades.
Entry Point Considerations
- Many traders wait for pattern completion. The pattern is generally considered unconfirmed until the third candle closes, as price action during an incomplete candle may change the final appearance.
- Entry timing varies by approach. Some traders enter immediately after the third candle closes, while others wait for the next candle to open and confirm continued bullish momentum. Breakout confirmation approaches wait for price to exceed the third candle's high before entering.
- Volume confirmation may provide additional validation. Higher volume on the third candle compared to preceding candles may indicate stronger conviction behind the buying pressure.
Stop-Loss Placement Approaches
- Some traders place stop-losses below the second candle's low, as this level's violation would suggest the indecision resolved bearishly rather than bullishly.
- Below the entire pattern formation offers wider protection but requires accepting larger potential losses. This placement provides more room for normal price fluctuation.
- Below nearby support levels integrates broader technical context into risk management. Risk tolerance and position sizing calculations influence which approach traders select.
Target Setting Methods
- Risk-reward ratio calculations may help inform target selection. Common ratios include 1:2 (risking one unit to potentially gain two) or 1:3. The distance from entry to stop-loss establishes the risk unit.
- Resistance level targets use chart-identified zones where selling pressure may increase. Previous support levels that became resistance often serve as logical targets.
- Fibonacci extension applications project potential price targets based on the pattern's dimensions. Trailing stop strategies allow profits to accumulate while protecting gains as price moves favorably.
What Indicators Confirm These Candlestick Signals
Technical indicators that commonly confirm this pattern include RSI showing oversold conditions (below 30), increasing volume on the third candle, proximity to support levels, and bullish MACD crossovers.
Volume Analysis: Volume increase on the third candle provides meaningful confirmation. Rising volume during the bullish candle indicates more market participants supporting the upward move.
Volume profile interpretation examines where volume accumulated during the pattern's formation. Low volume concerns arise when reversals form without notable trading activity, suggesting potentially weak conviction.
Momentum Indicators: RSI (Relative Strength Index) readings below 30 indicate oversold conditions, which align logically with reversal pattern opportunities. An RSI turning upward from oversold territory alongside the candlestick formation provides confluence.
Stochastic oscillator signals in oversold territory (below 20) offer similar confirmation potential. MACD bullish crossovers, where the MACD line crosses above the signal line, may confirm emerging upward momentum.
Momentum divergence, where price makes lower lows but momentum indicators make higher lows, adds another confirmation layer when occurring alongside the pattern.
Support and Resistance Context: Formation at established support zones strengthens the technical case. Multiple technical factors pointing toward the same conclusion enhance overall reliability.
Distance from moving averages matters. Patterns forming near major moving averages (50-day, 200-day) may interact with those levels as support or resistance.
Multiple timeframe analysis can be used to assess whether higher timeframe trends support or contradict the pattern's implications.
Limitations of the Morning Star Candlestick
This formation can produce false signals in volatile markets, may be subjectively interpreted by different traders, and works less reliably in shorter timeframes or without proper confirmation from additional technical indicators.
False Signal Scenarios
Patterns in choppy, sideways markets often fail because no clear trend exists to reverse. Without an established downtrend, the formation lacks proper context.
Insufficient preceding downtrends reduce significance. Brief or shallow declines may not represent true bearish control requiring reversal.
Low volume formations suggest potentially weak conviction behind the apparent reversal. Contradicting broader trend context, such as bearish patterns forming against long-term uptrends, may reduce reliability.
Interpretation Challenges
Subjectivity in candle size assessment creates variation among analysts. What one trader considers a "long" bearish candle, another might view as moderate.
Defining "small-bodied" middle candles involves judgment. No universal standard specifies exactly how small the middle candle must be relative to surrounding candles.
Gap requirement flexibility in modern interpretation means traders may disagree about whether specific formations qualify as valid patterns.
Market Condition Dependencies
Reduced effectiveness in range-bound markets occurs because reversal patterns require trends to reverse. High volatility may create formations that fail as erratic price action continues.
Liquidity considerations affect pattern reliability. Thinly traded securities may produce candlestick formations driven by limited order flow rather than broad market sentiment. News events can interfere with technical patterns, as fundamental developments may override technical signals.
How Reliable Is This Bullish Reversal Pattern?
This pattern shows higher reliability when it appears after extended downtrends, at significant support levels, with high volume on the third candle, and when confirmed by additional technical indicators, though no pattern guarantees specific outcomes.
Factors That Enhance Reliability
- Duration and strength of the preceding downtrend affect significance. Patterns following sustained, notable declines carry more reversal potential than those following minor pullbacks.
- Pattern formation at key support zones benefits from technical confluence. When multiple factors point toward potential support, reversal patterns at those levels may perform better.
- Volume characteristics matter considerably. Strong volume on the third candle indicates broad participation in the buying surge.
- Confluence with other technical signals (oversold momentum indicators, bullish divergences, trendline support) enhances the overall technical case.
Factors That Reduce Reliability
- Shallow or brief preceding declines provide less context for meaningful reversals. Formation in the middle of trading ranges lacks trend context.
- Low volume patterns suggest potentially weak conviction. Contradicting indicator signals, bearish momentum readings despite bullish candlestick formations, create uncertainty.
Common Trading Mistakes with the Morning Star Candlestick
Common mistakes include entering before pattern completion, ignoring volume confirmation, placing stops too tight below the formation, and trading these patterns without considering broader market context or trend direction.
- Premature Entry Errors: Trading before the third candle closes means acting on incomplete information. The candle's final appearance may differ from its intraday form. Anticipating pattern completion assumes the formation will complete as expected. Ignoring confirmation requirements increases exposure to false signals. Impatience in pattern development leads to poorly-timed entries.
- Confirmation Neglect: Skipping volume analysis removes a valuable confirmation tool. Ignoring additional indicators means missing potential warning signs. Missing broader trend context places too much emphasis on one pattern while overlooking larger market dynamics. Overlooking support and resistance levels eliminates important contextual information.
- Risk Management Issues: Inadequate stop-loss placement leaves positions exposed to larger-than-intended losses. Position sizing errors may result in excessive risk relative to account size. Unrealistic profit targets may cause premature exits or disappointment. Failure to adjust for market conditions treats all patterns identically despite varying contexts.
How Does Timeframe Affect Pattern Performance?
This pattern is typically used with greater reliability on daily and weekly charts compared to intraday timeframes, as longer periods filter market noise and represent more significant shifts in trader sentiment.
Daily and Weekly Chart Patterns
Enhanced signal reliability on longer timeframes results from reduced noise. Each candle represents more data points and participant decisions, filtering random fluctuations.
Reduced false signal frequency occurs because brief, meaningless price movements carry less weight in longer-term candles. Greater institutional participation on daily and weekly charts may produce more significant technical levels.
Intraday Pattern Considerations
Increased noise and false signals characterize shorter timeframes. Price fluctuations that would appear minor on daily charts may create apparent patterns on hourly or minute charts.
Faster confirmation requirements mean intraday traders must act more quickly. Different volume characteristics on intraday charts require adjusted interpretation frameworks.
Morning Star Candlestick Across Various Markets
This candlestick formation appears across all markets that use candlestick charting, including stocks, forex, commodities, and cryptocurrencies, though reliability may vary based on market liquidity and trading characteristics.
Forex Market Applications: 24-hour market considerations reduce gap occurrence since trading continues nearly continuously. Currency pair volatility differences affect how frequently clear patterns form. Gap occurrence frequency is lower in forex than in markets with discrete trading sessions. Major versus minor pair patterns may differ in reliability due to liquidity variations. To learn more on forex market candlestick patterns, you can check this TIOmarkets guide.
Stocks and Indices: Daily session gaps occur more frequently in equity markets, potentially producing more textbook formations. Earnings announcements and news events can dramatically affect price action, creating or invalidating patterns quickly. Sector rotation context adds complexity to individual stock patterns. Market capitalization considerations suggest patterns on large-cap stocks may differ from small-cap behavior due to liquidity differences.
Commodity and Crypto: Volatility characteristics in commodities and cryptocurrencies may produce frequent candlestick patterns but with varying reliability. Liquidity variations across different commodities and crypto assets affect pattern formation. Trading hour impacts differ between traditional commodity markets with session breaks and 24/7 cryptocurrency trading. Unique market dynamics in each asset class require adapted interpretation frameworks.
What to Do After Identifying a Morning Star?
After identifying this formation, traders usually wait for the third candle to close, check for volume confirmation and supporting indicators, assess risk-reward ratios, and plan entry, stop-loss, and target levels before executing positions.
1. Entry
Pattern completion verification confirms all three candles meet identification criteria. Volume confirmation check examines whether the third candle shows appropriate volume characteristics. Supporting indicator review assesses whether momentum indicators, support levels, and other technical factors align with the pattern's bullish implication. Risk-reward calculation determines whether potential reward justifies the risk required.
2. Trade Execution
Order type selection involves choosing between market orders (immediate execution at current price) and limit orders (execution at specified price or better). Position sizing based on risk can align exposure with risk tolerance and account management principles. Stop-loss order placement implements the predetermined risk management plan. Initial target setting establishes the first profit objective based on resistance levels or risk-reward ratios.
3. Post-Entry Management
Monitoring price action ensures the trade develops as anticipated. Adjusting stops as price moves favorably protects accumulating profits while allowing continued participation. Partial profit-taking approaches lock in gains at predetermined levels while maintaining exposure to further upside. Exit strategy adherence may help maintain discipline regardless of emotional responses to price fluctuations.
Conclusion
This three-candle bullish reversal pattern helps traders identify potential trend changes, though it is best if combined with volume analysis, supporting indicators, and proper risk management.
KEY TAKEAWAYS
- Pattern structure: Long bearish candle → small-bodied indecision candle → long bullish candle provides a framework for identifying potential downtrend reversals
- Confirmation enhances interpretation: Volume analysis, momentum indicators, and support level confluence substantially strengthen pattern signals
- Reliability depends on multiple factors like preceding downtrend characteristics, pattern location relative to key levels, and volume during the formation
- There are no guaranteed outcomes; false signals occur across all market conditions regardless of pattern quality
- Key limitations are subjective interpretation varies among traders, reduced effectiveness in range-bound markets, and timeframe-dependent reliability
- Integration with technical and fundamental analysis provides more comprehensive market assessment than relying on any single pattern

FAQ
Risk disclaimer: CFDs are complex instruments and come with a high risk of losing money rapidly due to leverage. You should consider whether you understand how CFDs work and whether you can afford to take the high risk of losing your money. Never deposit more than you are prepared to lose. Professional client’s losses can exceed their deposit. Please see our risk warning policy and seek independent professional advice if you do not fully understand. This information is not directed or intended for distribution to or use by residents of certain countries/jurisdictions including, but not limited to, USA & Countries included in the OFAC sanction list. The Company holds the right to alter the aforementioned list of countries at its own discretion.
TIOmarkets offers an exclusively execution-only service. The views expressed are for information purposes only. None of the content provided constitutes any form of investment advice. The comments are made available purely for educational and marketing purposes and do NOT constitute advice or investment recommendation (and should not be considered as such) and do not in any way constitute an invitation to acquire any financial instrument or product. TIOmarkets and its affiliates and consultants are not liable for any damages that may be caused by individual comments or statements by TIOmarkets analysis and assumes no liability with respect to the completeness and correctness of the content presented. The investor is solely responsible for the risk of his/her investment decisions. The analyses and comments presented do not include any consideration of your personal investment objectives, financial circumstances, or needs. The content has not been prepared in accordance with any legal requirements for financial analysis and must, therefore, be viewed by the reader as marketing information. TIOmarkets prohibits duplication or publication without explicit approval.
Join us on social media



Authors BIO

Maria is a writer and content strategist with over 10 years of experience in the finance industry. She specializes in developing research-backed articles that help financial professionals navigate complex market topics with confidence. Her expertise spans forex, stocks, CFDs and global markets, creating insightful content that educates readers and supports informed decision-making.








