


Shooting Star Candlestick Pattern: How to Identify and Trade It
BY Maria K.
|September 7, 2026A shooting star candlestick pattern is a bearish reversal formation that appears at the peak of uptrends. It’s characterized by a small body near the session low and a long upper shadow at least twice the body's length. This single-candle pattern signals that buyers initially pushed prices higher, but sellers regained control before the close, indicating potential momentum shifts.
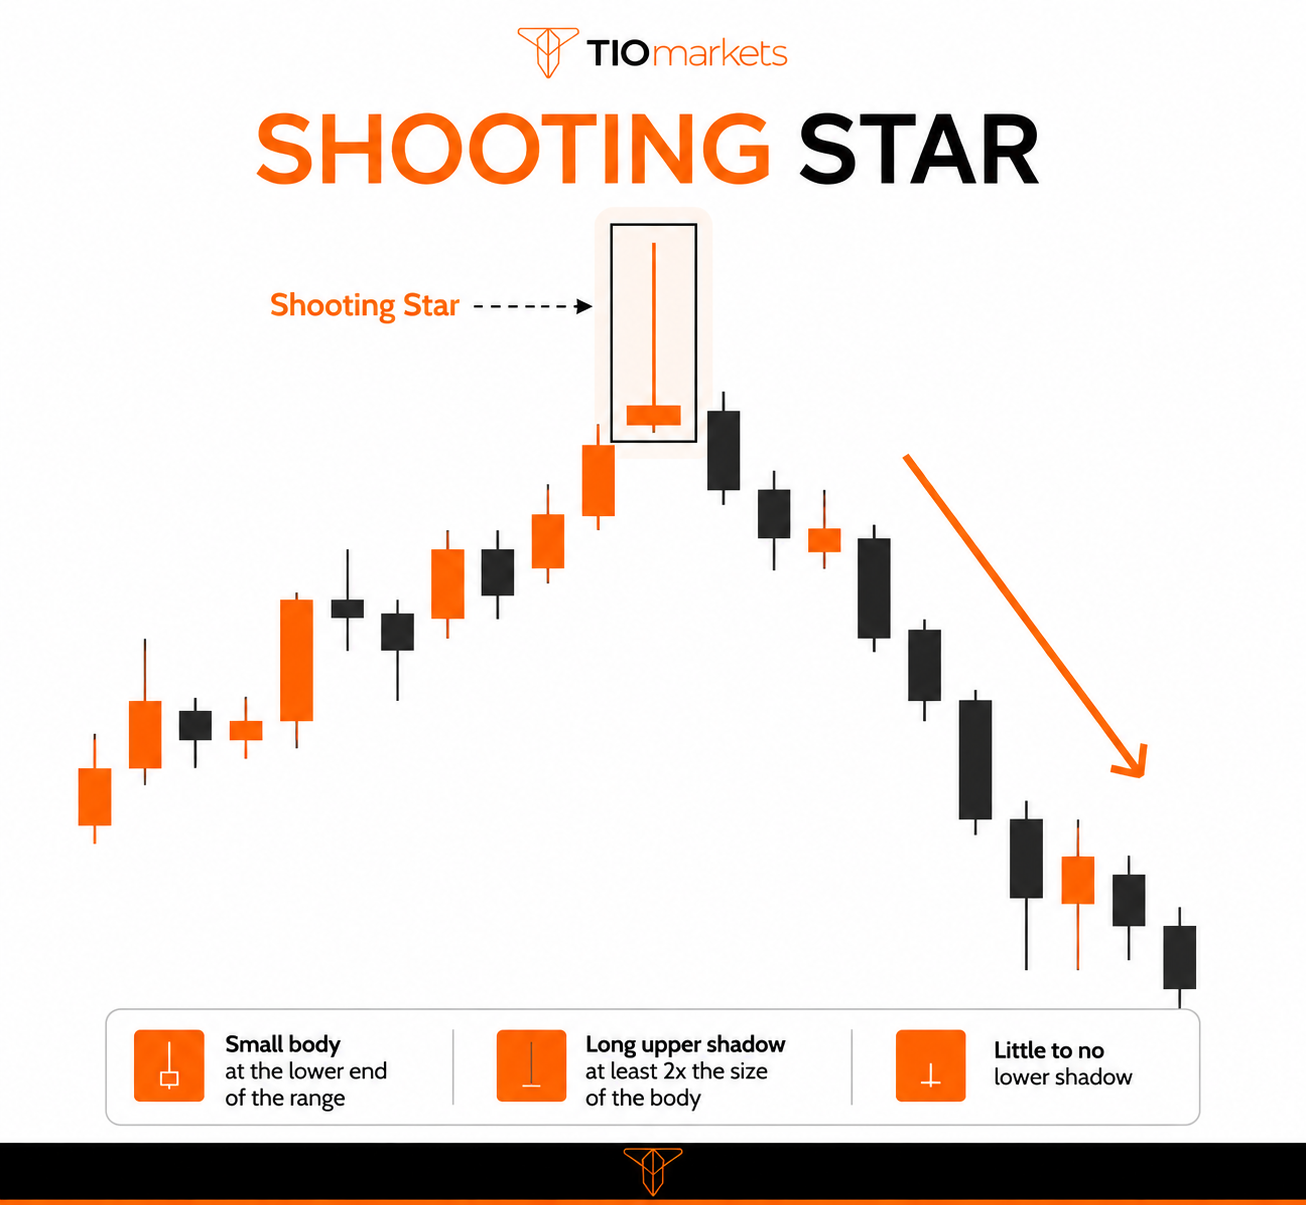
Understanding how to identify, confirm, and trade shooting star candlestick patterns may help traders evaluate timing for short entries and long position exits across stocks, forex, commodities, and cryptocurrency markets. Candlestick patterns, when combined with other technical indicators, may provide traders with actionable signals for potential trend reversals.
This comprehensive guide covers everything from basic identification criteria to advanced confirmation methods, helping traders understand when the shooting star candlestick pattern offers higher-probability setups and when caution is warranted.
Shooting Star Candlestick Pattern Basics
The shooting star candlestick pattern is a bearish reversal candlestick pattern that forms after an uptrend. It features a small real body near the session low, a long upper shadow (at least twice the body length), and little to no lower shadow, indicating buyers pushed prices higher but sellers regained control before the close.
Shooting Star Candlestick Definition and Characteristics
The shooting star candlestick pattern consists of three primary structural elements: a small real body positioned at or near the session's low, a long upper shadow extending significantly above the body, and minimal or no lower shadow. The pattern earns its name from its visual resemblance to a shooting star falling from the sky.
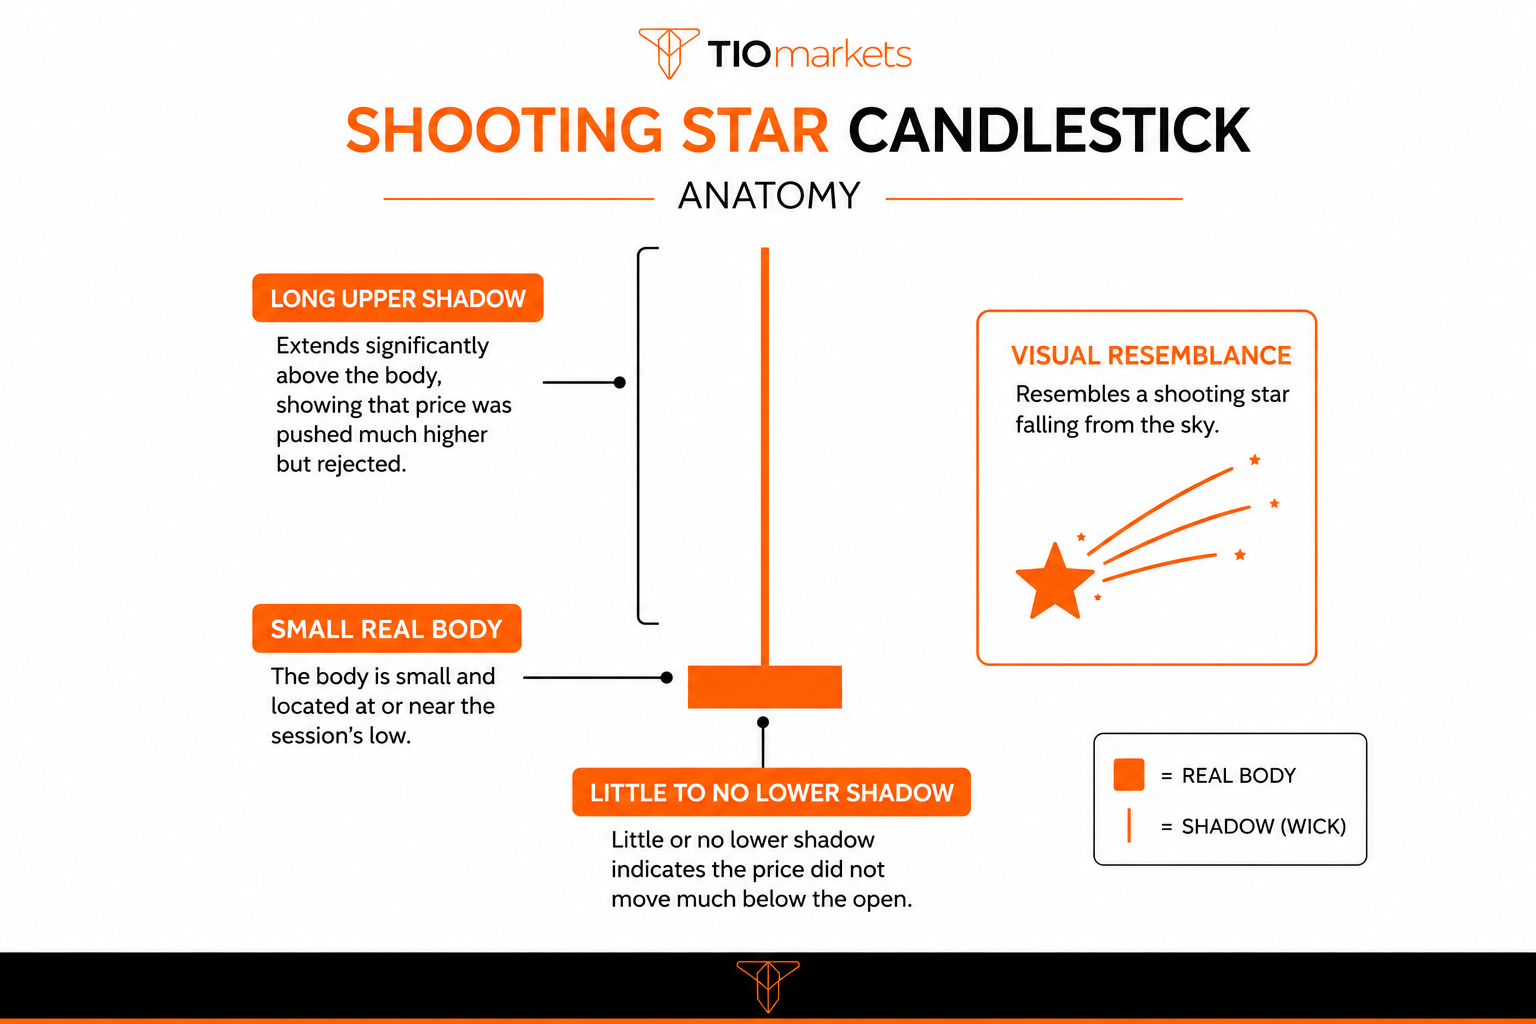
For a candle to qualify as a valid shooting star, the upper shadow should measure at least twice the length of the real body. Some technical analysts prefer a 3:1 ratio for higher-confidence signals. The body color - whether bearish (red) or bullish (green) - provides additional context, though both colors can form valid patterns.
Visual Structure Breakdown
Its visual structure tells a specific story about market dynamics during that trading session. The long upper shadow represents the distance between the session high and the close (or open, whichever is higher), while the small body shows the narrow range between the open and close prices.
Why It's Classified as a Bearish Reversal Pattern
Technical analysts classify the shooting star candlestick pattern as a bearish reversal pattern because it suggests a failed attempt by buyers to maintain higher prices. The rejection from upper levels indicates potential exhaustion of buying pressure and emerging selling interest. Traders use reversal formations like candlestick patterns as they believe they have higher reliability when appearing at significant price levels.
Market Conditions Required for Pattern Validity
Valid patterns require a preceding uptrend: typically defined as higher highs and higher lows over multiple sessions. The pattern loses significance in sideways or downtrending markets. Additionally, the shooting star gains credibility when forming near resistance levels, previous highs, or other technically significant price zones.
How Does a Shooting Star Candle Form?
The shooting star candlestick pattern forms when prices open, rally significantly creating a long upper wick, then reverse sharply as selling pressure intensifies, closing near or below the opening price with minimal lower shadow.
Price Action Sequence During Formation
During the session, prices typically open near the previous close or slightly gap up. Buyers then push prices significantly higher, creating an intraday rally that extends well above the opening price. However, this rally fails to hold as selling pressure emerges, driving prices back down toward the session low.
The Relationship between Open-High-Low-Close
The relationship between these four price points follows a specific pattern. The open occurs near the session low, the high extends significantly above (creating the upper shadow), and the close finishes near or below the open, also near the session low. This O-H-L-C structure creates the distinctive shooting star appearance.
What Does the Body Color Mean
While both red (bearish) and green (bullish) stars are considered valid, a red-bodied one carries marginally more bearish weight. A red body indicates the close was below the open, demonstrating that sellers not only rejected higher prices but pushed the close below where the session began.
What Do Shadow Proportions Signify
The upper shadow's length relative to the body communicates the strength of the rejection. Longer upper shadows suggest more aggressive selling into the rally, potentially indicating stronger reversal sentiment. The absence of a lower shadow (or minimal lower shadow) confirms that buyers found little opportunity to push prices below the opening level.
How to Interpret the Shooting Star Pattern
It reflects a shift from buyer dominance to seller control, where initial bullish momentum fails to sustain higher prices, suggesting exhaustion of the uptrend and emerging bearish sentiment.
Buyer Behavior at Session Start: At the session's beginning, buyers remain confident following the prior uptrend. They push prices higher, continuing the established momentum. This initial buying pressure creates the rally that forms the upper portion of the star's shadow.
Seller Intervention and Rejection: As prices reach elevated levels, sellers begin entering the market more aggressively. This selling pressure may come from profit-taking by existing longs, new short positions, or both. The key observation is that sellers successfully reject the higher prices, preventing the session from closing near its highs.
Momentum Shift Interpretation: The pattern suggests a potential momentum shift from bullish to bearish. The pattern indicates that buyers who previously controlled price direction may be losing strength, while sellers demonstrate an ability to move prices significantly lower from session highs.
Sentiment Change Indicators: Beyond the visual pattern, it also represents a psychological shift. Traders who were previously bullish may become cautious after seeing a failed rally. This sentiment change can create a self-reinforcing dynamic if subsequent sessions confirm the bearish interpretation.
How to Identify a Shooting Star Pattern: Recognition Criteria
Identify it by confirming the criteria: appears after an uptrend, upper shadow is at least 2x the body length, body is small and near the low, and lower shadow is minimal or absent. Moreover, context is important i.e the pattern forms near resistance or recent highs. Read on to find out about how to recognise a shooting star candle.
Essential Characteristics
1. Upper Shadow Measurement Criteria
The upper shadow should measure at least twice the length of the real body, with many analysts preferring a 3:1 ratio for higher-confidence signals. For example, if the body spans $1, the upper shadow should extend at least $2 above the body's top.
2. Body Size Relative to Recent Candles
The shooting star candlestick pattern's body should be notably smaller than recent candles in the uptrend. A large-bodied candle with a long upper shadow might be better classified as a different pattern or simply high-volatility price action.
3. Lower Shadow Requirements
The lower shadow should be minimal; typically no more than 10% of the total candle range. Some strict interpretations require no lower shadow at all for pattern validity.
4. Position Within the Trend
The pattern should appear after an established uptrend, ideally at or near swing highs. Those occurring mid-range or during consolidation carry less significance.
Context Requirements for Valid Patterns
- Prior Uptrend Confirmation: Confirm a preceding uptrend using swing highs and lows, moving average direction, or trend indicators. A minimum of 3-5 higher closes typically establishes sufficient uptrend context for the shooting star candlestick pattern to carry reversal implications.
- Position Relative to Support/Resistance: The ones forming at known resistance levels (previous highs, psychological round numbers, or Fibonacci extensions) tend to have higher historical significance. The confluence of pattern and level creates a stronger technical case.
- Distance from Moving Averages: Patterns forming when price is extended significantly above key moving averages (such as the 20 or 50-period MA) may indicate overbought conditions, potentially supporting the reversal interpretation.
Confirmation Methods: Validating the Reversal Signal
Confirming these patterns usually can be done via four approaches. One is waiting for the next candle to close below the body. Another is verifying increased selling volume. Of course you can be checking for bearish divergence in momentum indicators like RSI or MACD, or lastly verifying with multiple timeframes.
1. Price Action Confirmation
Next Candle Requirements: The most common confirmation method involves waiting for the following candle to close below the real body. This provides evidence that selling pressure continued beyond the pattern formation.
Break Below Shooting Star Low: A more conservative confirmation waits for price to break below the low. This confirms that sellers pushed prices below the entire pattern range, suggesting continued bearish momentum.
Gap Down Scenarios: When the session following our pattern opens with a gap down, this provides strong early confirmation of bearish sentiment. Gap downs indicate overnight selling pressure or negative news affecting market perception.
2. Volume Analysis for Validation
Volume Characteristics During Formation: Higher-than-average volume during formation suggests greater participation in the rejection. This indicates that the price reversal involved significant trading activity rather than low-conviction price movement.
Volume on Confirmation Candle: Increasing volume on the confirmation candle adds credibility to the reversal signal. Declining volume may suggest lack of follow-through conviction.
3. Technical Indicator Confirmation
RSI Overbought Readings: When they form while RSI reads above 70 (overbought territory), the pattern gains additional context. The combination suggests both price rejection and momentum exhaustion.
MACD Bearish Crossovers: MACD signal line crossovers occurring near the specific formation provide indicator-based confirmation of momentum shift.
4. Multiple Timeframe Confirmation
Higher Timeframe Context: When a shooting star on a lower timeframe aligns with resistance on a higher timeframe, the pattern gains significance. For example, a daily shooting star at weekly resistance represents multiple-timeframe confluence.
How to Trade the Shooting Star Candlestick Pattern
Here we analyse the most common trading approaches for the shooting star candlestick pattern.
These are: entering short positions after confirmation (next candle closes below pattern body), placing stop-loss orders above the upper shadow high, and targeting previous support levels or key Fibonacci retracement zones.
1. Conservative Entry Strategy
The conservative approach involves waiting for the confirmation candle to close below the body before entering. This reduces false signal risk but may result in a less favorable entry price if the move has already begun.
2. Aggressive Entry Approach
Aggressive traders may enter at the formation's close, accepting higher risk for potentially better entry prices. This approach works better in strongly overbought conditions with multiple confluence factors.
3. Stop-Loss Placement Techniques
A common stop-loss approach positions the stop above the star's upper shadow high, as a breach of this level would invalidate the pattern's bearish implications. Some traders add a buffer (such as 10-20 pips in forex) above the high for additional protection against normal price fluctuation.
4. Profit Target Methods
Common profit targets include previous support levels, Fibonacci retracement zone, and moving averages. Many traders aim for a minimum 1:2 risk-reward ratio, meaning the potential profit target is at least twice the distance to the stop-loss.
Shooting Star Candlestick Pattern Combined with Technical Indicators
Combining shooting star candlestick patterns with technical indicators like RSI (for overbought conditions above 70), moving averages (for resistance confluence), and Fibonacci levels (for retracement targets) is believed by some traders to be increasing pattern reliability and improving trade timing.
Shooting Star with RSI Strategy: When the pattern forms while RSI exceeds 70, the pattern appears in an overbought context. Bearish RSI divergence - where price makes a higher high but RSI makes a lower high - combined with a shooting star creates a particularly notable setup.
Shooting Star at Moving Average Resistance: These candlesticks forming precisely at the 50-day or 200-day moving average, when these averages act as resistance, combine two technical concepts into one setup. The moving average can also serve as a reference point for stop-loss placement.
Fibonacci Retracement Levels and Shooting Stars: The pattern in question appearing at key Fibonacci retracement levels (particularly 61.8% and 78.6%) during corrective rallies may indicate the retracement has exhausted and the larger trend will resume.
Shooting Star with MACD Confirmation: MACD bearish crossovers occurring simultaneously with a star formation provide momentum confirmation. Declining MACD histogram bars support the bearish interpretation.
Shooting Star vs Inverted Hammer: Understanding the Difference
While both patterns, shooting star and inverted hammer, have identical visual structures (small body, long upper shadow, minimal lower shadow), shooting stars appear after uptrends signaling bearish reversals. Inverted hammers form after downtrends indicating potential bullish reversals.
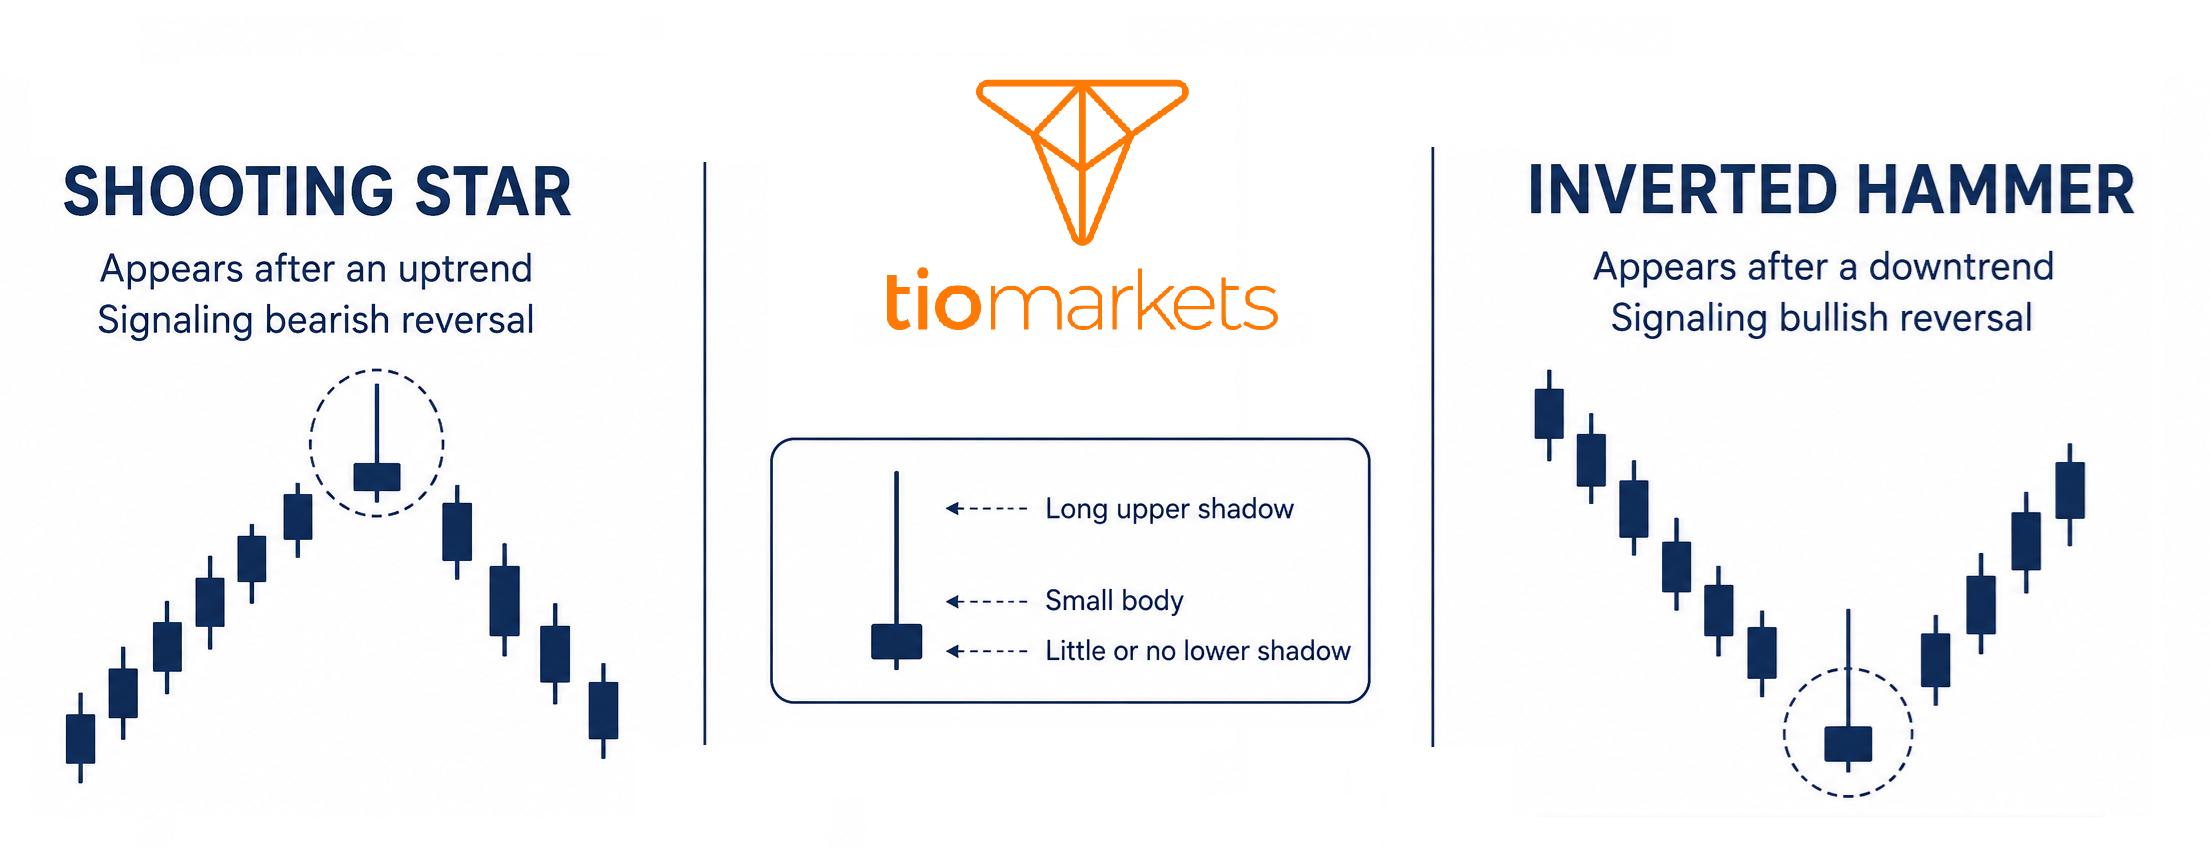
The shooting star and inverted hammer are visually indistinguishable when examined in isolation; both feature small bodies near the low with long upper shadows. The critical distinction lies entirely in context.
The star appears after uptrends and suggests bearish reversal potential. The inverted hammer appears after downtrends and suggests bullish reversal potential. This demonstrates why trend identification must precede pattern recognition in candlestick analysis.
Trading implications differ significantly: shooting stars may trigger short entries, while inverted hammers may trigger long entries, despite identical candle structures.
Shooting Star vs Hanging Man Pattern Comparison
The shooting star has a long upper shadow and small body near the low, while the hanging man features a long lower shadow and small body near the high; both are bearish patterns but form through different price action sequences.
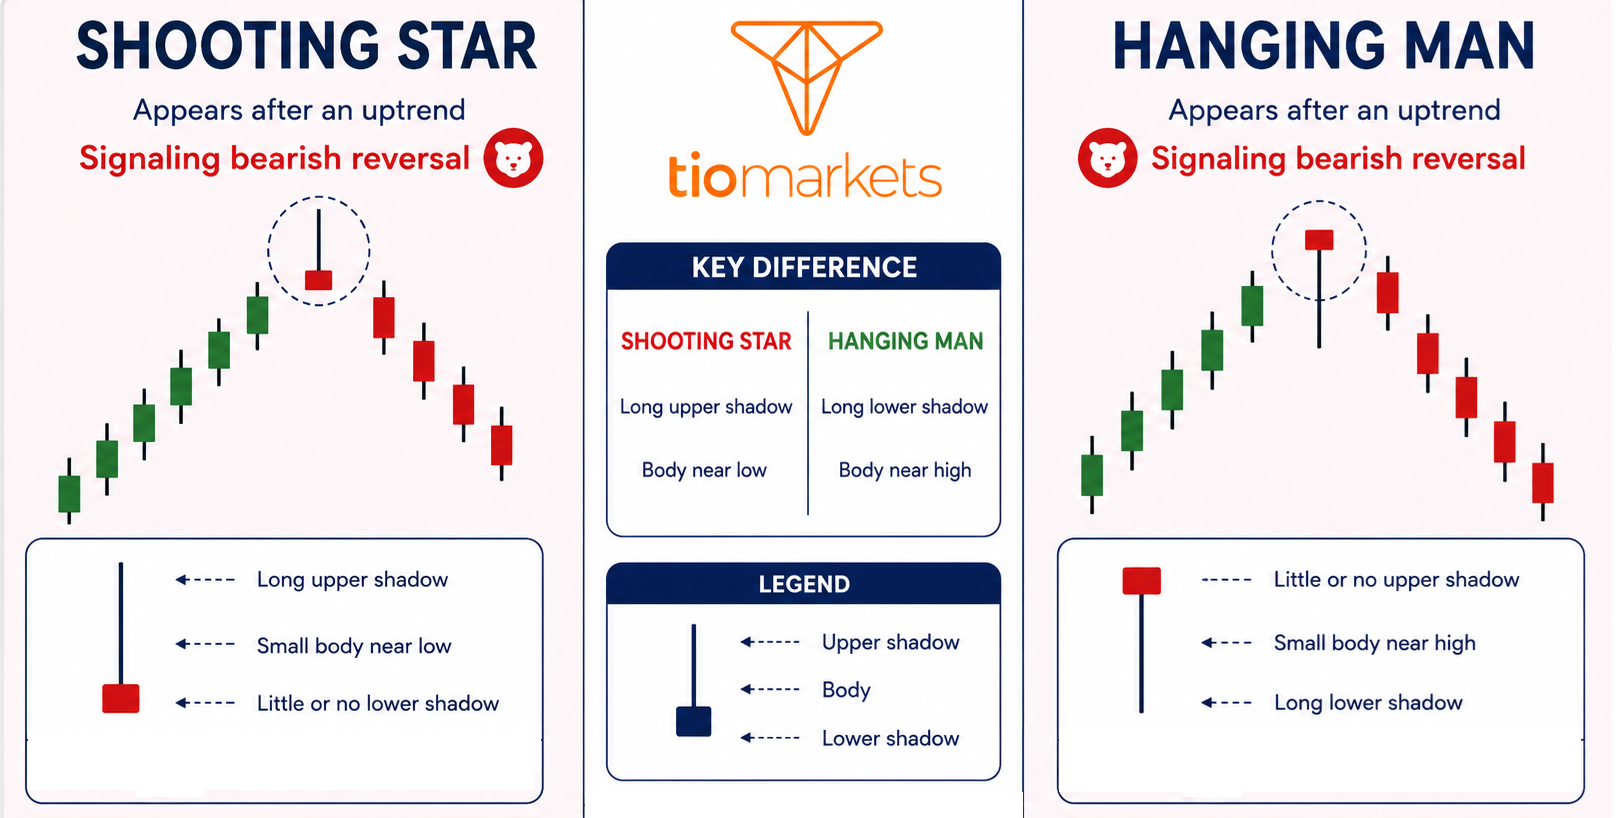
Unlike the shooting star versus inverted hammer comparison, the star and hanging man have different visual structures. The star's rejection occurs at high prices (creating the upper shadow), while the hanging man's rejection occurs at low prices (creating the lower shadow).
Both patterns appear after uptrends and carry bearish implications, but they represent different intraday dynamics. The shooting star shows failed buying attempts at higher levels, while the hanging man shows selling pressure that was temporarily absorbed before prices recovered.
What Are the Limitations of the Shooting Star Pattern?
Shooting star patterns can produce false signals in strong uptrends, require proper confirmation to avoid premature entries, lose reliability in ranging markets, and work best on daily or longer timeframes rather than intraday charts.
- False Signals in Strong Momentum Markets During powerful uptrends, stars may form repeatedly without resulting in reversals. Strong momentum can override reversal signals, leading to continuation despite pattern formation. Traders should assess overall trend strength before acting on shooting star signals.
- Confirmation Dependency Trading without confirmation increases false signal exposure. However, waiting for confirmation sometimes means missing the move entirely if the reversal accelerates quickly. This tension between confirmation and entry timing represents an inherent limitation.
- Market Condition Requirements The patterns lose significance in ranging or choppy markets where clear trends are absent. The pattern's reversal implication requires an established trend to reverse.
- Timeframe Considerations Lower timeframe shooting stars (below 1-hour) tend to generate more noise and less reliable signals. Daily and weekly timeframes generally provide more significant shooting star patterns due to the greater trading activity each candle represents.
Shooting Star Candlestick Pattern in Forex and Beyond
The patterns in question appear across all liquid markets including forex pairs, stock indices, individual equities, commodities, and cryptocurrencies, though confirmation requirements and volatility considerations vary by asset class.
Shooting Stars in Forex Trading
Forex shooting stars often form during session transitions (London-New York overlap) when liquidity conditions change. Major currency pairs typically provide cleaner patterns due to high liquidity.
Stock Market Shooting Star Patterns
In equities, they may form around earnings announcements or other news events. Volume analysis becomes particularly important, as meaningful patterns should show above-average participation.
Commodity and Futures Markets
Commodity markets may show stars at seasonal turning points or when approaching historical price extremes. Contract-specific considerations (expiration dates, contango/backwardation) can affect pattern interpretation.
Cryptocurrency Shooting Stars
Cryptocurrency markets operate 24/7, eliminating traditional session-based analysis. Higher volatility may require wider stop-loss placement to account for typical price swings.
Real-World Shooting Star Pattern Examples
Effective shooting star trades typically show the pattern forming at previous resistance, confirmation through increased volume and bearish follow-through, entry below the pattern low, stops above the high, and targets at the next support zone.
Consider a hypothetical example where a stock rallies from $45 to $52 over ten sessions. At $52, a shooting star forms with a $51.80 open, $54.20 high, $51.50 low, and $51.60 close. The upper shadow ($54.20 - $51.80 = $2.40) is more than twice the body ($51.80 - $51.60 = $0.20), meeting pattern criteria.
If the next day's candle closes at $50.80, below the pattern’s body, confirmation exists. A short entry at $50.80 with a stop at $54.50 (above the high) and a target at $47.50 (previous support) creates a defined risk-reward setup.
Failed shooting star examples occur when strong momentum continues despite the pattern. Understanding that not all stars result in reversals helps traders maintain realistic expectations.
Conclusion
The shooting star candlestick pattern serves as a potential bearish reversal indicator when properly identified and confirmed within appropriate market context. Effective application of this pattern requires understanding its formation psychology, applying strict identification criteria, waiting for confirmation through price action and volume, and implementing disciplined risk management.
Key Takeaways
Pattern Structure → Small body near session low, upper shadow at least 2x body length, minimal or no lower shadow
Formation Context → Must appear after an established uptrend to carry bearish reversal implications
Confirmation Methods → Wait for next candle to close below pattern body, verify increased volume, check RSI/MACD signals
Entry Strategy → Conservative: entering after confirmation candle; Aggressive: entering at shooting star close
Common Confluence → Pattern forming at resistance with overbought RSI (above 70) and declining momentum
Critical Distinction → Shooting star (bearish, after uptrend) vs. inverted hammer (bullish, after downtrend); same structure, opposite context

FAQ
Risk disclaimer: CFDs are complex instruments and come with a high risk of losing money rapidly due to leverage. You should consider whether you understand how CFDs work and whether you can afford to take the high risk of losing your money. Never deposit more than you are prepared to lose. Professional client’s losses can exceed their deposit. Please see our risk warning policy and seek independent professional advice if you do not fully understand. This information is not directed or intended for distribution to or use by residents of certain countries/jurisdictions including, but not limited to, USA & Countries included in the OFAC sanction list. The Company holds the right to alter the aforementioned list of countries at its own discretion.
TIOmarkets offers an exclusively execution-only service. The views expressed are for information purposes only. None of the content provided constitutes any form of investment advice. The comments are made available purely for educational and marketing purposes and do NOT constitute advice or investment recommendation (and should not be considered as such) and do not in any way constitute an invitation to acquire any financial instrument or product. TIOmarkets and its affiliates and consultants are not liable for any damages that may be caused by individual comments or statements by TIOmarkets analysis and assumes no liability with respect to the completeness and correctness of the content presented. The investor is solely responsible for the risk of his/her investment decisions. The analyses and comments presented do not include any consideration of your personal investment objectives, financial circumstances, or needs. The content has not been prepared in accordance with any legal requirements for financial analysis and must, therefore, be viewed by the reader as marketing information. TIOmarkets prohibits duplication or publication without explicit approval.
Join us on social media



Authors BIO

Maria is a writer and content strategist with over 10 years of experience in the finance industry. She specializes in developing research-backed articles that help financial professionals navigate complex market topics with confidence. Her expertise spans forex, stocks, CFDs and global markets, creating insightful content that educates readers and supports informed decision-making.








