


How Is CPI Calculated? How the US CPI Basket Is Built
BY TIOmarkets
|November 7, 2026The US Consumer Price Index (CPI) measures the average change over time in the prices of a fixed, spending-weighted basket of consumer goods and services. The question of how is CPI calculated has a two-stage answer: the Bureau of Labor Statistics (BLS) first averages sampled prices into small item-and-area indexes, then combines them with fixed expenditure weights into a national index.
The headline rate is therefore not a direct measure of anyone's cost of living. The weights, the within-item averaging and the treatment of housing determine what each release can tell a trader. Written for retail traders who watch the monthly US release, the explanation covers the basket, the weights, the calculation, a worked inflation example, core versus headline CPI and common misreadings.
What Is the Consumer Price Index and Why Its Method Matters
The index began as an instrument for wage setting. Prices climbed quickly during World War I, above all in the cities where ships were built, and cost-of-living wage adjustments needed a fuller gauge than any that existed. Its first weights came from family expenditure studies conducted in 92 industrial centres in 1917–19. The BLS published indexes for 32 cities from 1919 and a national US city average from 1921, with estimates extending back to 1913.
Several versions are now produced from the same price data. The CPI-U covers all urban consumers, the CPI-W covers urban wage earners and clerical workers, and the chained CPI (C-CPI-U) is a further all-urban measure. Each release reports index values with 1-month and 12-month percent changes, and the 12-month change is the figure most often referenced.
The method matters because the index tracks a defined pattern of spending rather than any household's actual bills. A renter in a large city and a homeowner who drives long distances face different mixes of prices. The PCE price index, a separate US measure with its own coverage and weights, can therefore show a different rate from the CPI in the same month without either being in error.
What Is in the CPI Basket? How Prices Are Collected
The CPI basket covers the goods and services urban consumers buy, from food and energy to rent and other services. For calculation, the BLS divides it into 7,776 item–area combinations, each pairing a category of items with a geographic area. Prices for the items in each combination are collected and compared with their earlier levels every month.
Housing is the component most often misread. The CPI prices the shelter service a housing unit provides, not the home as an asset, and owned housing units themselves are not priced. For an owner-occupied home, most of the shelter cost is owners' equivalent rent (OER): the implicit rent the owner would pay to rent the home without furnishings or utilities.
Rents are surveyed directly. Each month the BLS collects rents for one panel of units and computes a 6-month price ratio for each, dividing the current rent by the rent six months earlier. Shelter therefore enters the index through observed rents rather than house purchase prices, which is why it responds to the housing market with a lag.
How Are CPI Weights Determined?
CPI weights come from spending, not from prices. They are derived from household surveys that record how much consumers spend in each category. Each year, with the January CPI release, the expenditure reference period moves to the most recent survey data, so the basket follows shifts in spending only with a delay.
A weight is published as relative importance: a component's expenditure or value weight, expressed as a percentage of all items within an area. Relative importance for the CPI-U and CPI-W appears once a year using December data, and monthly at the US level in the news release tables. The December 2025 table uses 2024 weights, and a version with 2023 weights is also published.
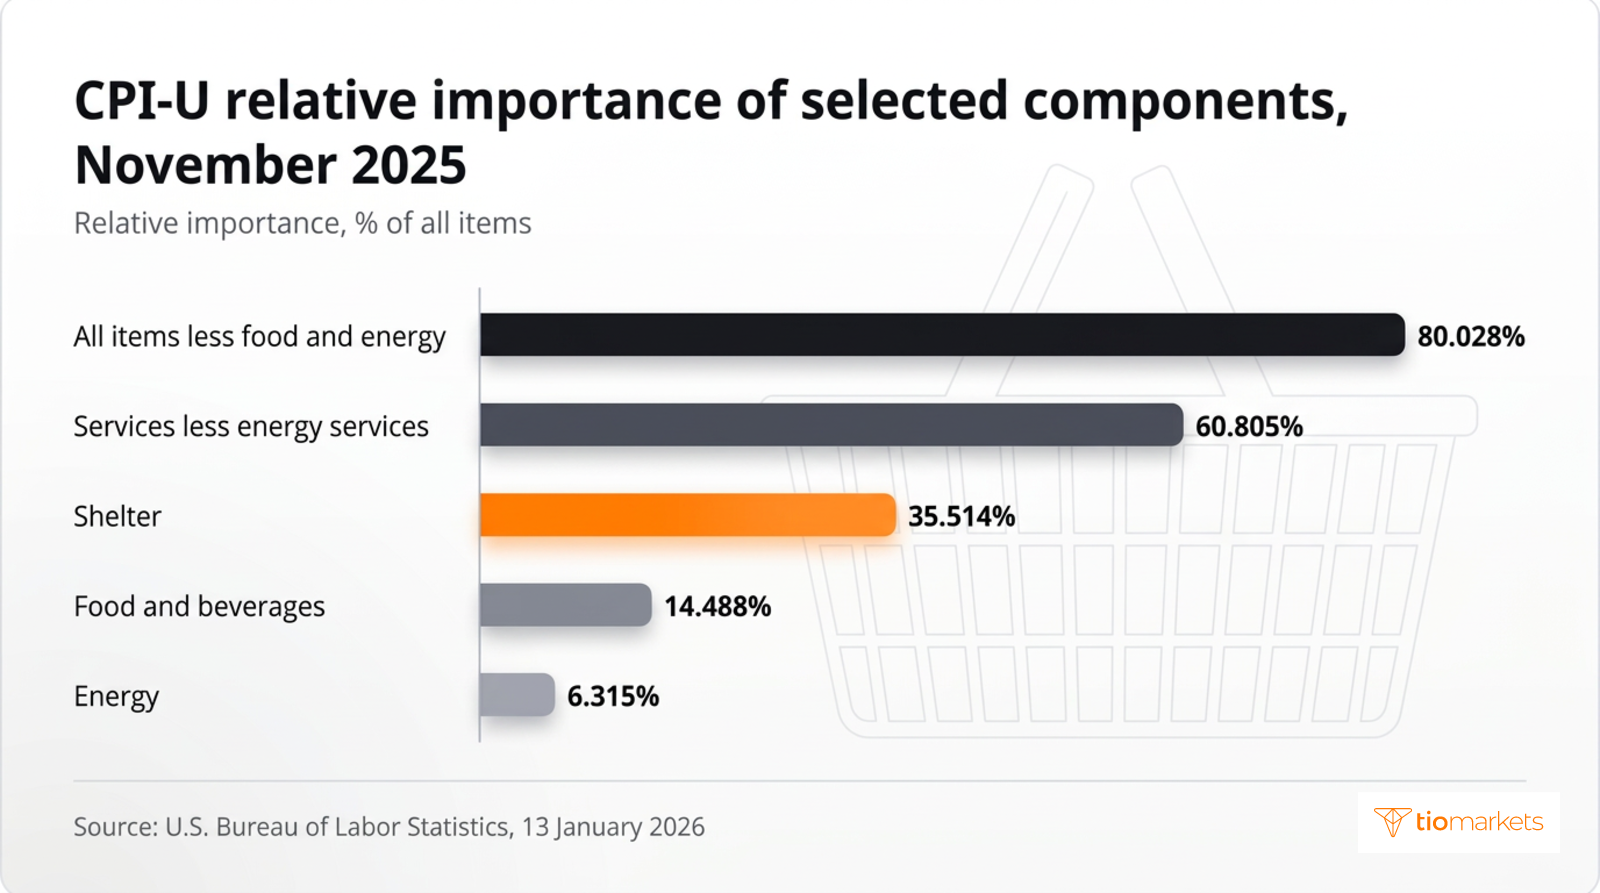
The December 2025 release, published on 13 January 2026, gives CPI-U relative importance as of November 2025. Shelter carried 35.514, food and beverages 14.488 and energy 6.315. All items less food and energy carried 80.028, and services less energy services 60.805.
Owners' equivalent rent accounts for most of shelter. A separate BLS breakdown puts owners' equivalent rent of residences at 26.204 of a 35.625 shelter weight, against 7.840 for rent of primary residence. These ratios describe the weighting scheme only. They cannot be used to estimate current spending patterns or changes in spending between weight revisions.
How Is CPI Calculated? From Price Samples to an Index Level
The consumer price index calculation runs in two stages. First, the BLS computes a basic index for each of the 7,776 item–area combinations, showing the average price change of the items within it. An item's price change is the ratio of its current price to its price at an earlier time. Second, the BLS combines those basic indexes into higher-level indexes as weighted averages, using the expenditure weights.
There is no single consumer price index formula, because the stages use different averages. Beginning in January 1999, a geometric mean formula replaced the Laspeyres formula for most basic components. A geometric mean implicitly lets the quantity bought fall as an item's relative price rises, which better reflects substitution within a category, such as switching brands. The change was intended to correct substitution bias, while a limited number of strata kept a modified Laspeyres formula.
| Formula | Where it is used | How it averages | Treatment of substitution |
| Geometric mean | Most basic CPI components, since January 1999 | Geometric average of price changes within an item–area combination | Allows for substitution; meant to correct substitution bias |
| Modified Laspeyres | A limited number of strata | Ratio of weighted arithmetic means of current and previous prices | Quantities held at estimates from the sampling period |
| Expenditure-weighted aggregation | Combining the 7,776 basic indexes into higher-level indexes | Weighted average using expenditure weights | Weights fixed until the annual January update |
Every published variant, the chained index included, draws on the same mix of basic indexes, and the output is an index level rather than a rate. CPI-U indexes use an index base period of 1982–84=100. A December 2025 reading of 331.550 for all items less energy therefore means that basket cost 331.550 for every 100 it cost in 1982–84. Textbook explanations of how to calculate CPI use one ratio: the basket's current cost divided by its base-period cost, multiplied by 100. The official index applies that principle through its two stages instead of pricing a single basket directly.
The index is calculated and published every month. October 2026 data are scheduled for 10 November 2026 at 08:30 ET, November data for 10 December 2026 and December data for 13 January 2027. Release times for each are listed in the TIOmarkets economic calendar.
How to Calculate Inflation Rate Using CPI: A Worked Example
For a trader, the answer to how is inflation calculated comes down to a percent change between two index levels. The CPI formula for that change is: inflation rate = (later index ÷ earlier index − 1) × 100. Applied to the CPI-U all items less energy series, not seasonally adjusted, over the 12 months to December 2025, the calculation takes five steps:
- Take two levels from the same series, with the same seasonal treatment and base: 322.828 for December 2024 and 331.550 for December 2025.
- Divide the later level by the earlier one: 331.550 ÷ 322.828 = 1.0270.
- Subtract 1 and multiply by 100: (1.0270 − 1) × 100 = 2.70%.
- Round to one decimal place, the precision of the published rates. The result, 2.7%, matches the published change from December 2024 to December 2025.
- For a month-on-month rate, apply the same formula to adjacent months. Seasonally adjusted levels give the monthly change the release leads with.
The arithmetic in this CPI calculation example reproduces the change in the published index and nothing more. It inherits every choice made in building that index, from the weights to the treatment of shelter. A rate computed from rounded levels can differ slightly from the official figure, and combining an adjusted level with an unadjusted one yields a number that matches no published series.
Core CPI vs Headline CPI and Why Dollar Traders Read Both
Headline CPI is the all-items index, while core CPI is all items less food and energy. As of November 2025, core carried a relative importance of 80.028 and energy 6.315. Energy is small in weight but volatile in price, so the two measures can diverge sharply in a single month.
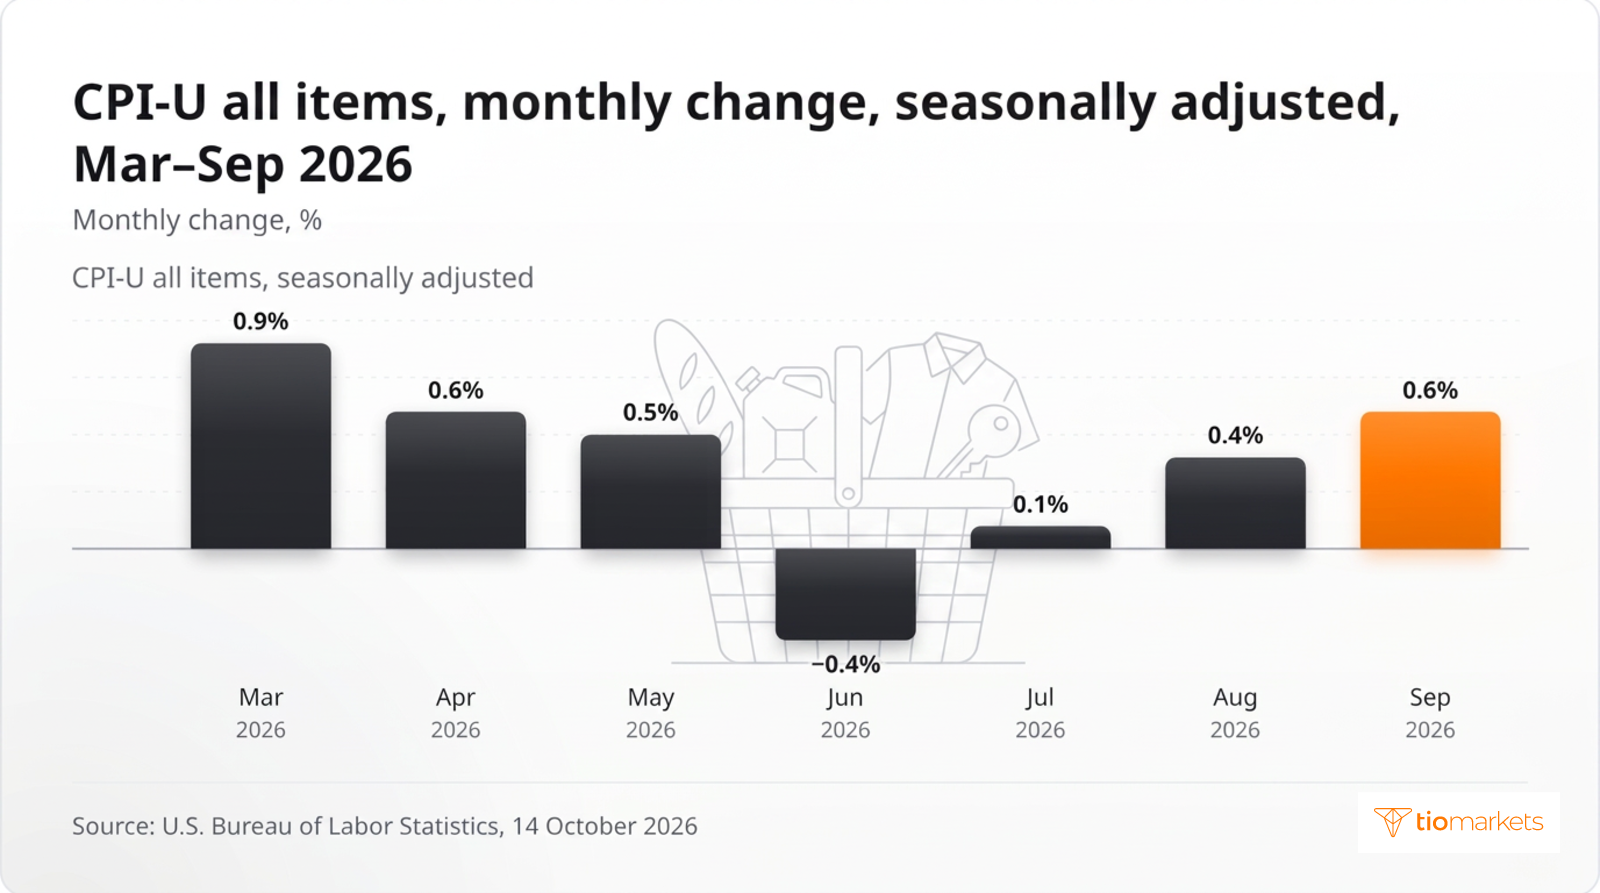
The September 2026 release, published on 14 October 2026, illustrates the gap. The energy index rose 5.2% on the month and 20.4% over 12 months, and gasoline rose 9.1%, accounting for over half of the monthly all-items increase. Headline CPI-U rose 0.6% seasonally adjusted and 3.7% over 12 months before adjustment, while core rose 0.3% and 2.6%.
| Measure | What it covers | Weight, Nov 2025 | 12 months to Dec 2025 | Sep 2026: month / 12 months |
| Headline CPI-U | Every item in the basket | Whole index | 2.7% | 0.6% / 3.7% |
| Core CPI | All items less food and energy | 80.028 | 2.6% | 0.3% / 2.6% |
| Energy | Gasoline and other energy items | 6.315 | 2.3% | 5.2% / 20.4% |
| Shelter | Rent and owners' equivalent rent | 35.514 | 3.2% | 0.4% / – |
Seasonal adjustment removes price patterns that recur at the same time each year, so that consecutive months can be compared. On that basis, the headline index rose 0.9% in March 2026, fell 0.4% in June and rose 0.6% in September.
Dollar traders read both measures because they carry different information. Headline CPI shows what the whole basket cost, whereas core CPI removes the most volatile components and gives a steadier view of underlying price pressure. Because inflation data bear on interest-rate expectations, market participants follow both when reading the US Dollar Index and pairs such as EUR/USD around a CPI release.
Common Mistakes When Reading CPI Figures
Most misreadings come from treating a constructed index as a direct measurement of the prices people pay. Five recur:
- Treating CPI as a personal cost of living. The index prices a fixed, survey-weighted basket for urban consumers, and an individual household's spending mix can differ widely from it.
- Reading relative importance as current spending. Weights reflect earlier household spending surveys and cannot show how spending has shifted since the last revision.
- Mixing adjusted and unadjusted figures. The headline monthly change is seasonally adjusted, while the 12-month change is quoted before seasonal adjustment.
- Assuming house prices are in the index. Homeowners' costs enter through owners' equivalent rent, built from rents compared over six-month intervals.
- Overlooking gaps in the data. A lapse in appropriations meant October 2025 survey data could not be collected, and the September 2026 release lists October and November 2025 values as not available.
Conclusion
The monthly CPI rate is not a reading of any household's cost of living. It is the change in the cost of a fixed basket for urban consumers, weighted by past household spending and assembled from 7,776 elementary indexes. Shelter carries more than a third of that basket and is measured through rents, while geometric averaging within items allows for some substitution. Those choices decide what a headline or core reading can say about price pressure, and what it cannot.
The method also limits what any single release can show. Weights are revised once a year and reflect earlier spending, shelter trails the housing market through six-month rent ratios, and collection can stop altogether, as it did for October 2025. The same index can therefore understate one household's price changes and overstate another's.
Trade from anywhere with the TIOmarkets Trading and Investing Mobile App
Trade over 950 instruments with built-in TradingView charts and competitive spreads, all from your phone, in real time.
Trading is risky
FAQ
Risk disclaimer: CFDs are complex instruments and come with a high risk of losing money rapidly due to leverage. You should consider whether you understand how CFDs work and whether you can afford to take the high risk of losing your money. Never deposit more than you are prepared to lose. Professional client’s losses can exceed their deposit. Please see our risk warning policy and seek independent professional advice if you do not fully understand. This information is not directed or intended for distribution to or use by residents of certain countries/jurisdictions including, but not limited to, USA & Countries included in the OFAC sanction list. The Company holds the right to alter the aforementioned list of countries at its own discretion.
TIOmarkets offers an exclusively execution-only service. The views expressed are for information purposes only. None of the content provided constitutes any form of investment advice. The comments are made available purely for educational and marketing purposes and do NOT constitute advice or investment recommendation (and should not be considered as such) and do not in any way constitute an invitation to acquire any financial instrument or product. TIOmarkets and its affiliates and consultants are not liable for any damages that may be caused by individual comments or statements by TIOmarkets analysis and assumes no liability with respect to the completeness and correctness of the content presented. The investor is solely responsible for the risk of his/her investment decisions. The analyses and comments presented do not include any consideration of your personal investment objectives, financial circumstances, or needs. The content has not been prepared in accordance with any legal requirements for financial analysis and must, therefore, be viewed by the reader as marketing information. TIOmarkets prohibits duplication or publication without explicit approval.
Join us on social media


Authors BIO

Behind every blog post lies the combined experience of the people working at TIOmarkets. We are a team of dedicated industry professionals and financial markets enthusiasts committed to providing you with trading education and financial markets commentary. Our goal is to help empower you with the knowledge you need to trade in the markets effectively.





