


Anthropic and G10 Currency Flows Explained
BY TIOmarkets
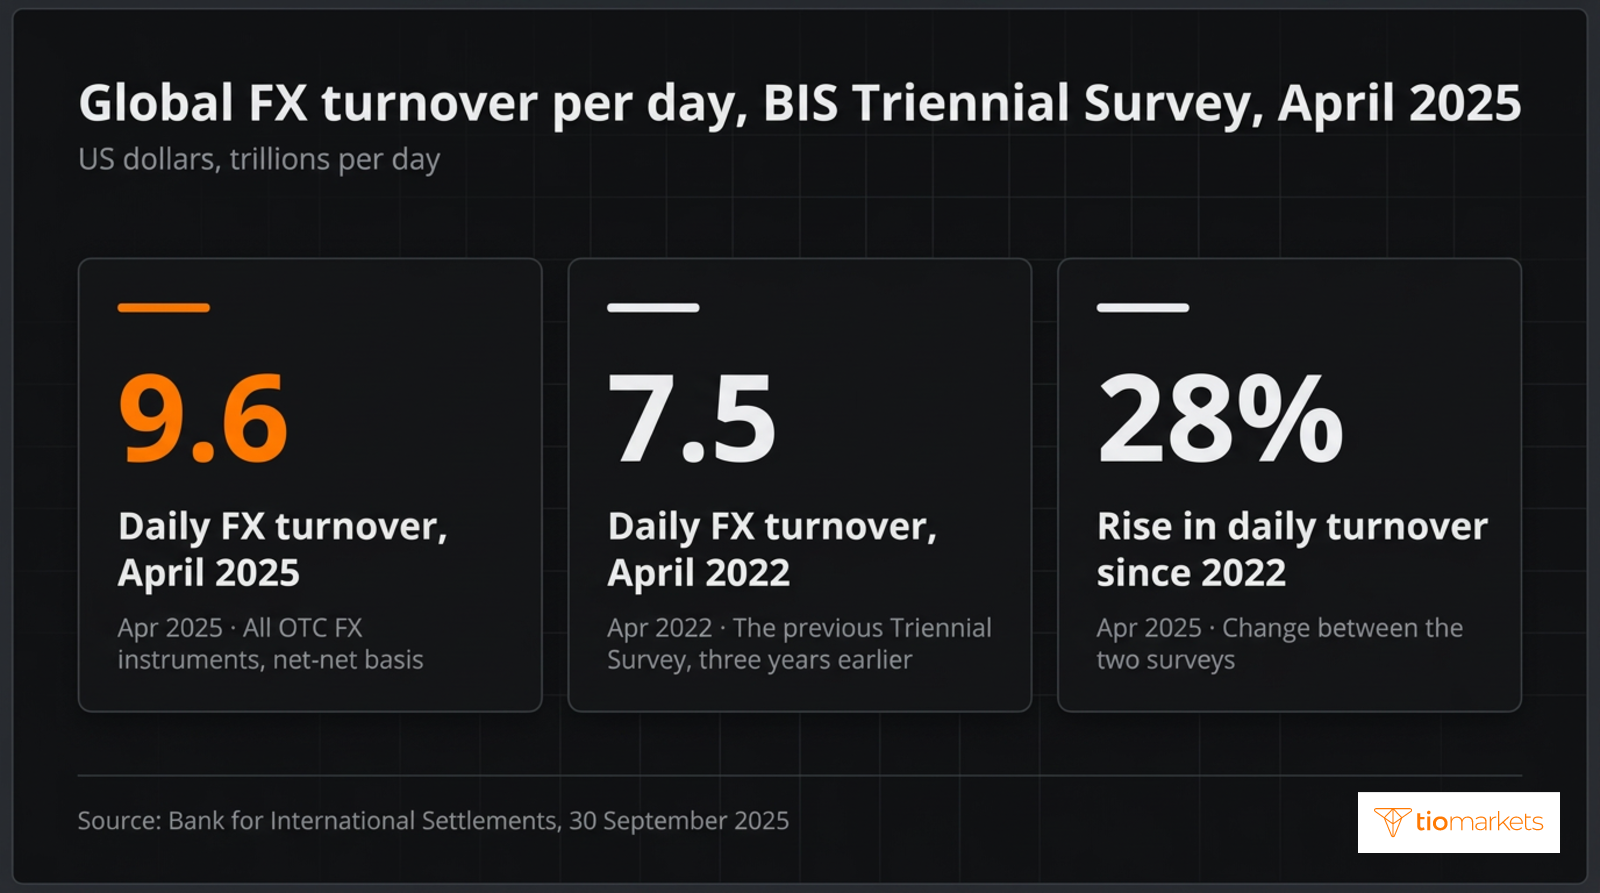
|November 19, 2026The link between Anthropic and G10 currency flows is the set of measurable channels through which money raised, spent and earned by the US artificial intelligence developer could change demand for the dollar against other major currencies. How AI investment affects the US dollar depends on those channels, whose flows are small beside $9.6 trillion of daily FX turnover and reach official statistics weeks after the event.
Written for forex traders who meet 'AI flows' in commentary on EUR/USD or USD/JPY, the article compares four channels through which AI capital could reach a G10 currency, the data that measure each, and the steps for testing a claim against Treasury International Capital (TIC) data.
Anthropic and G10 Currency Flows: What the Claim Means
Market reports often attribute dollar moves to foreign buying of US artificial intelligence companies. Behind talk of AI capital flows, forex commentary assumes one chain: a foreign investor sells its home currency, buys dollars, then buys a stake. Anthropic draws the claim because of its private rounds: $13 billion in September 2025, $30 billion in February 2026 and a $65 billion Series H in May 2026 at a $965 billion valuation.
For exchange-rate purposes, a currency flow is a cross-border transaction that requires one currency to be exchanged for another. Scale is the first test of any such claim. The Bank for International Settlements (BIS) Triennial Survey recorded global FX turnover of $9.6 trillion a day in April 2025, 28% above the $7.5 trillion of three years earlier. Even the whole Series H, converted at once, would be a small fraction of one day's trading.
What Are G10 Currencies?
In the FX market, the G10 currencies are the US dollar, euro, Japanese yen, British pound, Swiss franc, Canadian dollar, Australian dollar, New Zealand dollar, Norwegian krone and Swedish krona. The dollar dominates: its share of turnover in April 2025 was 89.2%, against 28.9% for the euro, 16.8% for the yen and 10.2% for sterling, out of 200% because each trade has two currencies. A G10 flow story is therefore first a dollar story, and how exchange rates work in the majors applies across the group.
The balance of payments records a country's transactions with the rest of the world: trade, services and income in the current account, and assets in the financial account. The financial account separates foreign direct investment, a lasting stake with influence over the company, from portfolio investment, holdings without that influence. Capital flows and exchange rates connect through currency demand: a flow moves a rate only when one currency is sold for another and no hedge offsets the sale.
A euro-area pension fund that sells euros to buy a stake in a US company creates a financial-account inflow and euro selling in EUR/USD; a fund already holding dollars sells no euros. Commentary often reads such flows through the US Dollar Index (DXY), and how the DXY is used in forex trading rests on the same G10 rates.
How AI Investment Affects the US Dollar: The Four Channels
Claims about AI investment currency flows rest on four channels: foreign investment in US AI companies; the hedging attached to it; cross-border spending on data centres and chips, including hyperscaler capex (the capital spending of the largest cloud providers); and revenue earned abroad and converted into dollars.
Anthropic has entered into leases for data-centre capacity in Australia and Canada, both G10 currency areas, carries future compute obligations of about $417 billion and earned overseas revenue above $4.5 billion in the first half of 2026. That is how data centre spending moves currencies: paying for Canadian capacity in Canadian dollars requires buying them, while a contract invoiced in US dollars requires no exchange.
Each channel has data that can confirm or contradict it:
| What the chart or market shows | The approach traders use for it | Main risk |
| Commentary links dollar strength to foreign buying of US AI shares | Reading monthly TIC net purchases by country of residence, bonds and equities combined | Residence is not ownership, and the data arrive weeks late |
| Large foreign equity inflows with little change in the dollar | Comparing inflows with hedging in FX forwards and swaps | Hedge ratios are absent from flow data |
| Data-centre and chip commitments outside the US | Reading filings for location and timing, then direct investment data | Payments may span years and be invoiced in US dollars |
| Rising overseas revenue at a US technology company | Reading revenue by region and current-account services data | Receipts may be invoiced in dollars or kept abroad |
Where Anthropic Fits: Foreign Investment in US AI Companies
Anthropic raised capital in private funding rounds, negotiated transactions whose investors' currency of origin is not published. Its named foreign investors sit outside the G10 currency areas: Singapore's GIC joined the September 2025 round and co-led both the February 2026 round and the Series H, and the Qatar Investment Authority took part in all three. Any conversion would involve the Singapore dollar or the Qatari riyal, not EUR/USD or USD/JPY.
How Is Foreign Investment in US Stocks Measured?
A private funding round and a purchase of listed US tech shares differ in measurement, not in currency: either reaches the exchange rate only if the investor buys dollars it does not already hold and leaves them unhedged.
Shares bought by a non-US fund on a US exchange enter the monthly TIC figures for foreign net purchases of US equities, assigned to the counterparty's country of legal residence. A private round is not exchange-traded: any cross-border stake would surface in the quarterly balance-of-payments financial account, whose securities lines draw on TIC data. One company's shares cannot be isolated in the monthly equity figures, which appear in the month after next.
FX Hedging by Foreign Equity Investors
An FX hedge ratio is the share of a foreign holding whose currency exposure is offset, usually with forwards or FX swaps, the instruments also used for hedging currency positions. A yen-based investor buying US shares unhedged sells yen for dollars, adding the whole purchase to dollar demand in USD/JPY. Fully hedged, it also sells the dollars forward, leaving net demand close to zero; half hedged, net demand equals the unhedged half.
Hedging costs follow the interest-rate gap, because forward rates reflect the difference between the two currencies' rates. A wide gap between US and Japanese rates makes hedging dollar assets dearer for a yen-based investor, so hedge ratios can shift and move USD/JPY with no change in holdings, one reason the rate gap behind USD/JPY is central to flow analysis. Hedging of this kind shows in turnover, not flow data: the hedging of US dollar exposures partly lifted the April 2025 total.
How to Track Capital Flows in Forex
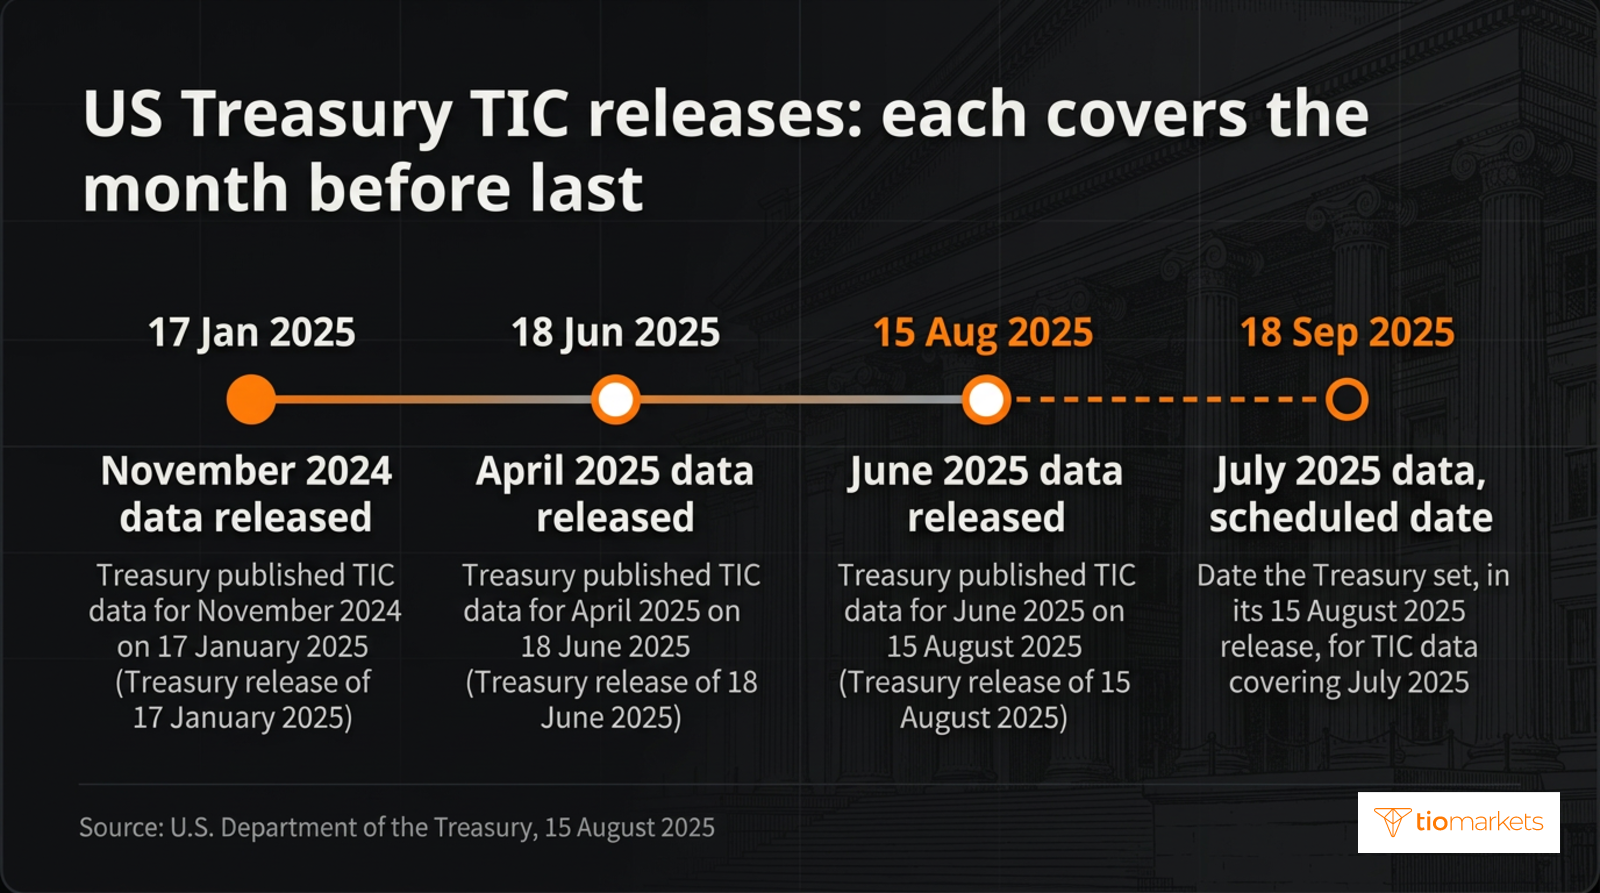
The US Treasury publishes TIC data monthly and by country, each release covering the month before last. November 2024 data appeared on 17 January 2025, April 2025 data on 18 June 2025 and June 2025 data on 15 August 2025, with July 2025 data set for 18 September 2025. In June 2025, foreign residents' net purchases of long-term US securities were $192.3 billion and the net TIC inflow was $77.8 billion.
Testing a claimed AI flow against these releases takes seven steps:
- Open the monthly TIC press release and note which month it covers.
- Read foreign residents' net purchases of long-term US securities, split between private and official investors.
- Note the net TIC flow, which adds short-term securities and banking flows.
- Find net purchases by country of residence, such as Japan; these cover bonds and equities together.
- Compare each figure with earlier months, as the series are not seasonally adjusted.
- Check the quarterly balance-of-payments financial account for direct investment, where a large private stake would appear.
- Set the totals against global FX turnover of $9.6 trillion a day.
The procedure inherits the limits of its inputs: TIC data cannot attribute holdings of US securities to countries with complete accuracy, so a shift in one country's line is only rough evidence of how that country's investors changed their US positions.
Net purchases by Japanese residents of all US long-term securities, not equities alone, were -7,709 million US dollars in November 2025, -10,134 million in December, 17,900 million in January 2026, -12,435 million in February and -20,320 million in March. Such figures show the size and direction of foreign buying, never its motive.
Limits of Linking AI Spending and Currencies
Scale is the first limit on any link between AI spending and currencies: average daily turnover in Japan's FX market alone was USD 440.2 billion in April 2025, and a funding round is a single transaction whose announced amount is not the amount converted.
Causation is the second limit. Strong foreign buying of US technology shares can coincide with shifting expectations for Federal Reserve policy, and monthly totals cannot separate a purchase made for an AI theme from one made for US yields. Rate expectations usually dominate G10 pricing, so an account of the AI boom and the US dollar that omits yields is incomplete: much of the link between tech investment and exchange rates runs through them.
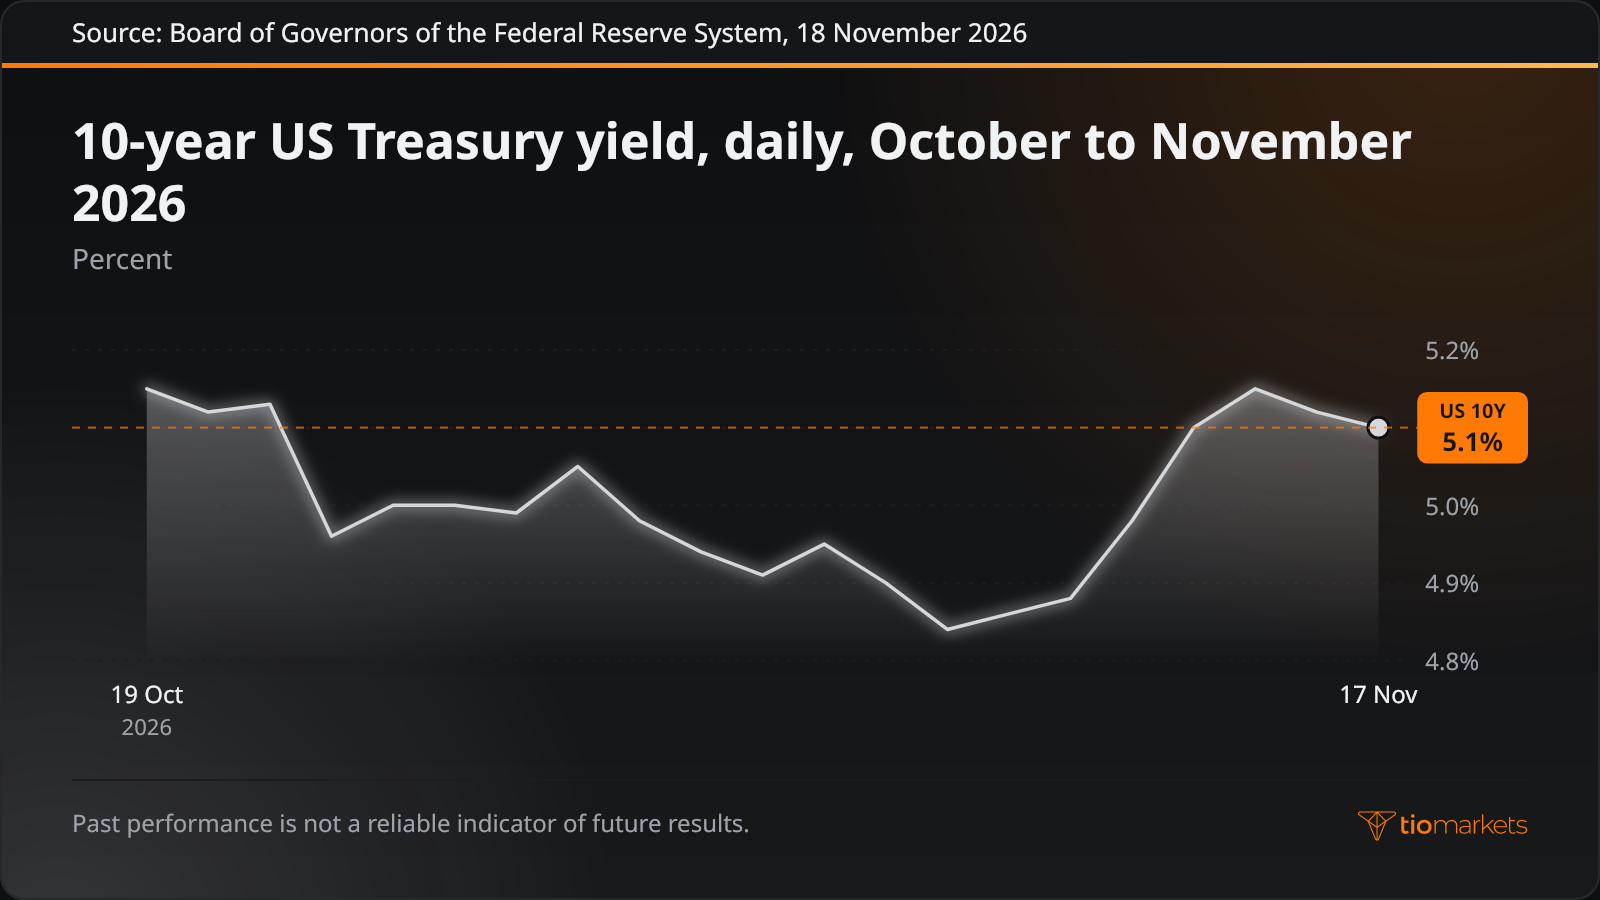
The 10-year US Treasury yield is one benchmark for those expectations and the backdrop against which AI-related flows into US assets have been priced. Past performance is not a reliable indicator of future results.
Conclusion
For a forex trader, the AI-flows story is a hypothesis about currency demand that the data can test. An AI company's capital raising reaches G10 exchange rates only where money changes currency, mainly through foreign equity inflows net of hedging. Anthropic's $65 billion Series H was small beside $9.6 trillion of daily turnover, and no official flow series reports one company's transactions on their own. Country tables, the financial account and the rate backdrop are therefore the evidence a claim must meet.
Flow data carry limits of their own: they arrive in the month after next, follow residence and cannot attribute holdings exactly, so a confirmed flow is always a late one. A trader who takes a leveraged position in EUR/USD or USD/JPY on a flow narrative faces a further risk: leverage magnifies losses as well as gains, losses can build quickly when the pair moves against the position, and the trader can lose all the money deposited.
Symbols in this article




Trade USD/JPY and EUR/USD with TIOmarkets
Take your position on global markets via CFDs. Enjoy tight spreads, fast execution, and fast, flexible funding options.
Trading is risky
FAQ
Risk disclaimer: CFDs are complex instruments and come with a high risk of losing money rapidly due to leverage. You should consider whether you understand how CFDs work and whether you can afford to take the high risk of losing your money. Never deposit more than you are prepared to lose. Professional client’s losses can exceed their deposit. Please see our risk warning policy and seek independent professional advice if you do not fully understand. This information is not directed or intended for distribution to or use by residents of certain countries/jurisdictions including, but not limited to, USA & Countries included in the OFAC sanction list. The Company holds the right to alter the aforementioned list of countries at its own discretion.
TIOmarkets offers an exclusively execution-only service. The views expressed are for information purposes only. None of the content provided constitutes any form of investment advice. The comments are made available purely for educational and marketing purposes and do NOT constitute advice or investment recommendation (and should not be considered as such) and do not in any way constitute an invitation to acquire any financial instrument or product. TIOmarkets and its affiliates and consultants are not liable for any damages that may be caused by individual comments or statements by TIOmarkets analysis and assumes no liability with respect to the completeness and correctness of the content presented. The investor is solely responsible for the risk of his/her investment decisions. The analyses and comments presented do not include any consideration of your personal investment objectives, financial circumstances, or needs. The content has not been prepared in accordance with any legal requirements for financial analysis and must, therefore, be viewed by the reader as marketing information. TIOmarkets prohibits duplication or publication without explicit approval.
Join us on social media


Authors BIO

Behind every blog post lies the combined experience of the people working at TIOmarkets. We are a team of dedicated industry professionals and financial markets enthusiasts committed to providing you with trading education and financial markets commentary. Our goal is to help empower you with the knowledge you need to trade in the markets effectively.